
Performance Summary
From a return perspective, the US Equity Strategy portfolio performed in line with the S&P 500 Total Return Index (net of fees) during the quarter. Our Canadian Equity Strategy underperformed the S&P/TSX Composite Total Return Index in the quarter. Both the US and Canadian Equity Strategies continued to outpace their respective benchmarks in terms of dividend growth. For a more detailed discussion on performance see each Strategy’s respective section below.
Portfolio Dividend Growth – Trailing and consensus forward 12 months
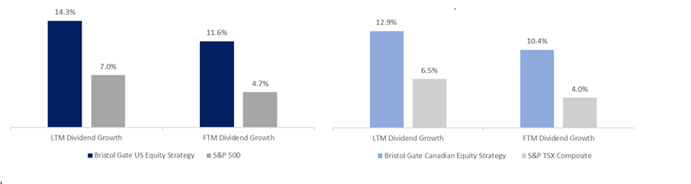
Note: Last 12 months (“LTM”) Dividend Growth is the median of the actual trailing 12-month dividend growth of the individual stocks held by Strategies or Index constituents as reported by Bloomberg as at Sep 30, 2023. Forward 12 months (“FTM”) Dividend Growth is the median of the Bristol Gate Model’s forward 12-month prediction for the individual stocks held by the Strategies and the median of consensus estimates for the constituents of the Indices as of quarter end. Companies without a consensus dividend forecast were excluded. Return commentary based on gross returns.
Source: Bloomberg, FactSet, Bristol Gate Capital Partners
Market Recap
The S&P 500 gave back some of the year-to-date gains in Q3, falling over 3%. Although the Fed opted to maintain its benchmark interest rate in September, it indicated that it is not done raising rates in 2023, possibly diminishing the chances of a soft landing and driving the market 5% lower in September alone. With wages remaining strong and unemployment levels low, the elements that may contribute towards any potential rate cuts remain missing.
The “Magnificent Seven” stocks, which have provided the bulk of the market’s gains year-to-date retreated in Q3. The Energy sector was by far the best performing, rising 12%, benefitting from higher oil prices. Large caps continued to outperform small caps.
Exhibit 1: Various Asset Class Year-to-Date Returns
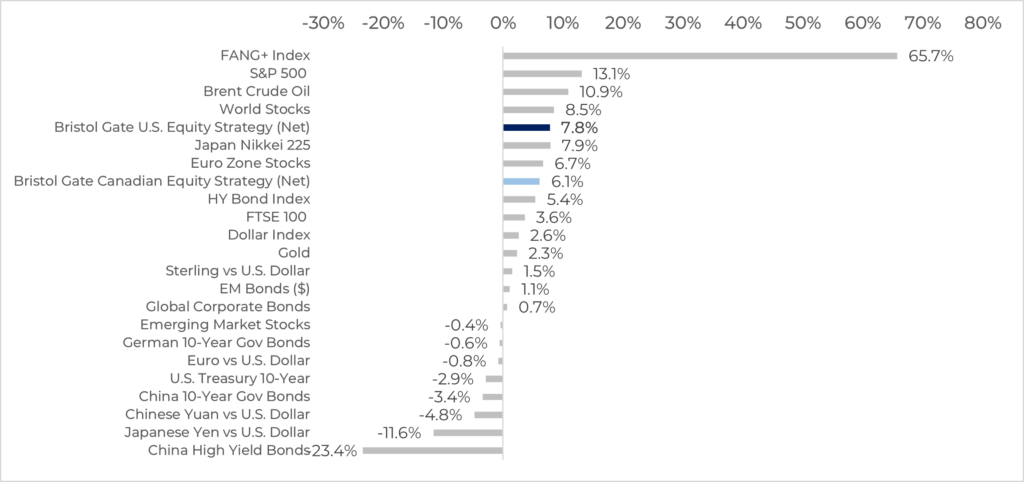
Bristol Gate US Equity Strategy returns are in USD net of 1% fee. Bristol Gate Canadian strategy returns are in CAD net of 0.7% fee. Source: Bristol Gate Capital Partners, LSEG Datastream, Reuters, Oct 2, 2023
US Equity Strategy (all returns USD)
The Bristol Gate US Equity Strategy performed in line with the benchmark (net of fees) during the quarter despite a zero weight in Energy.
Top Contributors:
Stock selection in the Information Technology, Health Care and Communication Services sectors contributed to the portfolio’s relative performance during the quarter.
On an absolute basis, Activision Blizzard, Intuit and MSCI were amongst the top contributors during the quarter. Activision shares held steady as the market gained confidence that their acquisition by Microsoft would clear regulatory hurdles. Intuit continues to deliver sturdy top line and earnings growth and management reiterated their guidance for strong long-term growth expectations. MSCI’s quarterly results topped street expectations and the company continues to grow all their major business segments at attractive rates.
Bottom Detractors:
Having no exposure to the outperforming Energy sector was the largest headwind for the portfolio in the quarter (~50bps on a relative basis). Both stock selection and our overweight to Real Estate also detracted from returns.
On an absolute basis, American Tower (AMT), Microchip Technology (MCHP) and Allegion (ALLE) were amongst our bottom contributors during the quarter. AMT has been our worst performing stock year-to-date, hampered by higher interest rates, volatile foreign exchange and customer consolidation. We also believe it has suffered from some indiscriminate selling of the Real Estate sector. Real Estate was the second worst performing sector in the Index during the quarter. Unlike other segments within the sector that are exposed to poor or deteriorating fundamentals (retail, commercial office, etc.), we see robust underlying demand for AMT’s wireless and data center infrastructure assets globally, for the foreseeable future as we move to a “connected everything” world. While higher rates do pose a challenge given the company’s debt load, we believe its current customer consolidation headwinds are largely behind it and expect a near term catalyst when the company sells a majority stake of its Indian business. The company’s CEO said they are in the late stages of the sale process and reiterated his confidence in getting a deal done shortly at a recent investor conference. In the meantime, AMT announced a dividend increase of 10% y/y in September.
Portfolio Positioning
We increased our weights in Allegion and Corteva as both fell below our quarterly rebalancing weight threshold and sourced the funds from sales of Broadcom and Intuit.
During the quarter, we exited our position in Dollar General (DG). We initially invested in DG in 2020 due to its attractive dividend growth, its business model focused on value and convenience and a reasonable valuation. We expected the company to provide some ballast to our portfolio, particularly in difficult economic times as consumers increasingly searched for value. The current economic environment, characterized by high inflation and growing pressure on consumer spending budgets, was the exact type of scenario where we thought DG could thrive. However, after reporting a disappointing Q1/23 result we became increasingly concerned about the firm’s competitive positioning and operational execution, namely:
– The effect persistent inflation was having on the financial health of the low-end consumer, as well as the fact that higher-income consumers did not become more price conscious and start to shop at DG, which normally would offset that impact.
-The growing complexity of DG’s business and supply chain with the implementation of several initiatives to drive sales, like DG Fresh which introduces produce but brings challenges such as cold storage, food safety, rotting, etc.
-Increasing competitive pressure resulting in negative traffic trends. Retail giants continue to invest in omnichannel delivery capabilities gradually eroding DG’s rural moat while lowering prices to attract consumers.
-A view that DG had underinvested in labour as its business has become more complex and its stores experienced growing incidents of theft and employee safety concerns.
With the above concerns, and a deteriorating dividend growth prediction, we decided to sell DG just prior to the company reporting Q2/23 results at the end of August. Q2 also fell short of expectations and the stock has fallen over 30% since our sale.
We used the proceeds from DG to purchase CSX Corp., a leading transportation company. CSX provides rail, intermodal and other services to a broad array of markets through their network of approximately 20,000 route miles of track connecting the Eastern United States and Canada.
In addition to a growing dividend, CSX exhibits many of the fundamental attributes we look for in a ‘Bristol Gate company’:
• The company has a large opportunity to gain market share, as the North American transportation market, estimated to be approximately $900B, is still mostly (approximately two-thirds) still addressed by trucking. As such there is a large opportunity to gain market share as rail is a more efficient and environmentally friendly alternative to trucking.
• The company operates in an industry with oligopolistic characteristics. Consolidation over the last 50 years has resulted in six Class 1 railroads in North America, accounting for approximately two thirds of the industry’s mileage and over 90% of freight revenues. Many local markets are monopolies or duopolies for the railroads.
• CSX is a best-in-class operator, and the company’s high free cash flow margins have enabled consistent dividend growth that is expected to continue. Expected volume and service level recoveries from COVID-related supply chain disruptions should lead to better pricing and revenue going forward. The high fixed cost nature of the business should mean a lot of that recovery falls to the bottom line.
• We also find the company’s current valuation attractive, particularly relative to the broader market where it is trading near decade-plus lows.
Outlook:
From a corporate earnings perspective, the broad market’s performance remains lackluster. The S&P 500 saw earnings decline on relatively flat revenues in the second quarter. Our portfolio companies continue to deliver far superior operating results than most S&P 500 companies. They are generating consistent revenue growth and the operating leverage we expect from high quality companies despite being in a difficult macro environment.
Exhibit 2: Bristol Gate Fundamentals vs S&P 500 Index
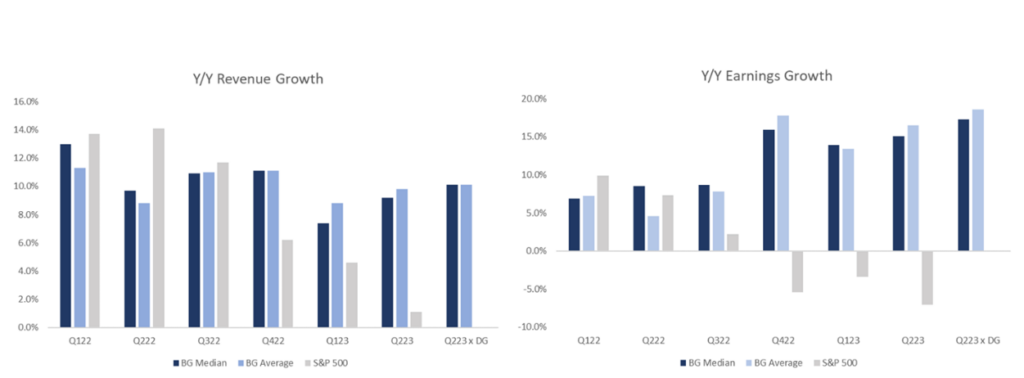
As at September 22, 2023. Source: Bloomberg, Zacks, Bristol Gate Capital Partners
The strong fundamental performance has supported dividend increases that have exceeded the market’s mid-single digit y/y growth rate by a wide margin.
Exhibit 3: Bristol Gate Holdings YTD Dividend Increases
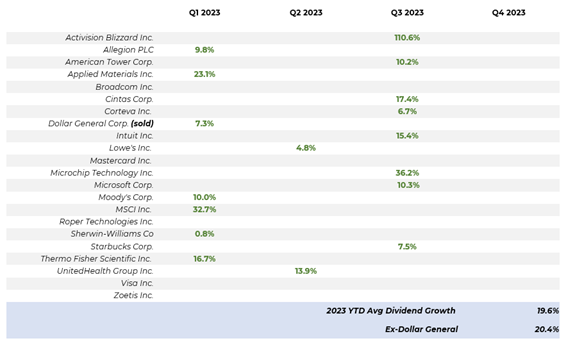
Source: Bristol Gate Capital Partners. As at Sep 30, 2023
As discussed above, much of the market’s gains this year have come from the fundamental performance and related multiple expansion of just a small subset of stocks, namely, the ‘Magnificent Seven’. Those companies have had an outsized impact on the Index due to their large market weights. Outside that group, the Index’s 493 other companies have collectively struggled. Despite this, the market’s forward earnings multiple has remained at a similar value to the beginning of the year. In contrast, our portfolio companies are trading at a 5% discount relative to their valuations to the start the year, with much stronger revenue and earnings growth:
We remain confident that our companies will continue to demonstrate the fundamental consistency they have thus far this year and our unique approach to high dividend growth investing will serve our clients well in the long term.
Exhibit 4: Bristol Gate US Equity Strategy vs Magnificent Seven vs S&P 500
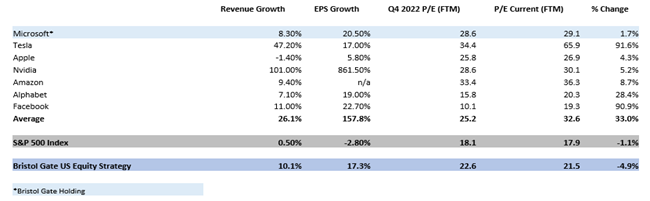
Source: Bristol Gate Capital Partners, Bloomberg. As at Sep 30, 2023
Exhibit 5: Bristol Gate US Equity Strategy Risk and Return Metrics
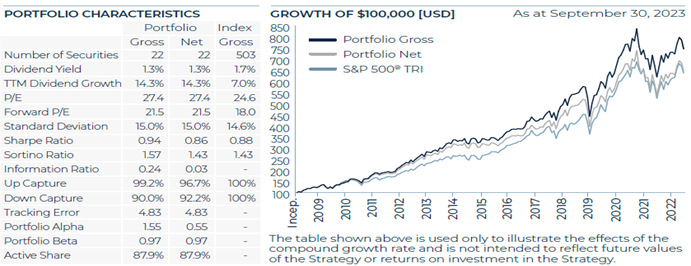
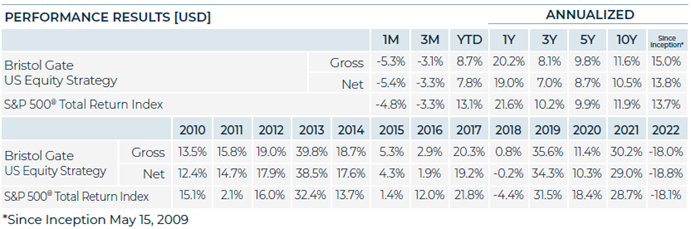
Source: Bristol Gate Capital Partners. There is a risk of loss inherent in any investment; past performance is not indicative of future results. Please see important disclosures at end of document.
Canadian Equity Strategy (all returns CAD)
The S&P/TSX declined by over 2% during the third quarter of the year. The decline was broad but was cushioned by the Energy sector which rose over 10%. The Bank of Canada held rates steady in September, as although core inflation remains higher than the central bank’s target, higher interest rates have had their desired effect and economic growth has slowed domestically.
Portfolio Review:
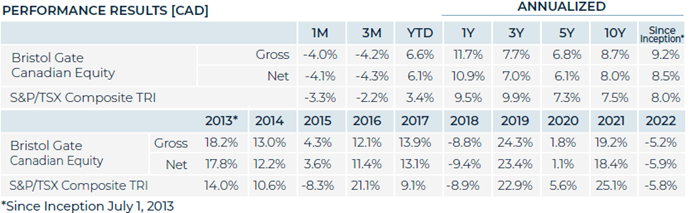
The Canadian Equity strategy underperformed the benchmark in the quarter.
From a fundamental perspective, we are pleased with how our portfolio companies are navigating an environment where corporate growth broadly has been challenged. Year-to-date, 15 of our businesses have raised their dividends by an average of 10.4%, and delivered strong second quarter earnings, averaging 11.5% revenue growth and 2.4% EPS growth respectively, which stacks up well compared to the index:
Exhibit 6. Canadian Equity Strategy Risk and Return Metrics
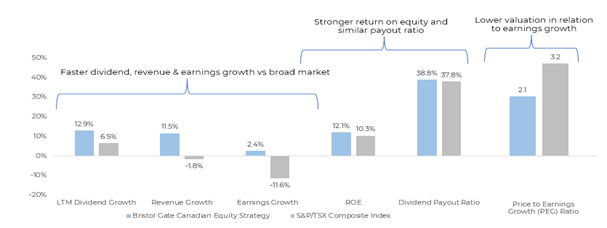
Source: LSEG I/B/E/S, Bristol Gate Capital Partners, Bloomberg. As at Sep 30, 2023
Portfolio Positioning:
As per our quarterly rebalancing process, we increased our weights in Jamieson Wellness and Enghouse Systems as both fell below our threshold and sourced the funds from sale of shares in Alimentation Couche-Tard, Colliers International and Premium Brands Holdings.
Top Contributors:
Stock selection in the Consumer Discretionary and Real Estate sectors contributed to the strategy’s returns, as did not having exposure to the underperforming Utilities sector.
On an absolute basis, Dollarama, Colliers International and Zoetis were amongst the largest contributors to returns.
Bottom Detractors:
The underperformance for the quarter can almost entirely be attributed to not having any exposure to the Energy sector. Stock selection in the Consumer Staples also detracted from returns.
On an absolute basis, Jamieson Wellness, Open Text and CCL Industries were amongst the bottom detractors in the quarter.
Exhibit 7. Canadian Equity Strategy Risk and Return Metrics
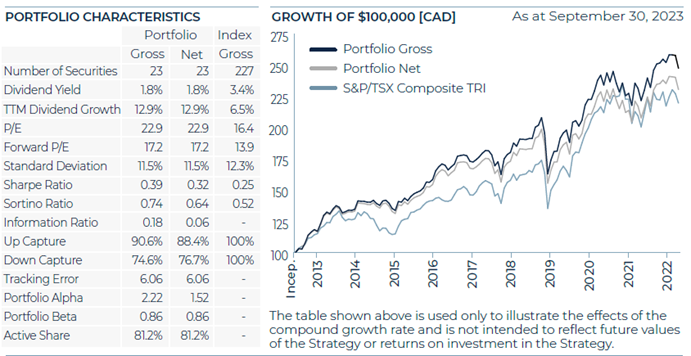
Source: Bristol Gate Capital Partners. There is a risk of loss inherent in any investment; past performance is not indicative of future results. Please see important disclosures at end of document.
Firm Update
To all our clients, thank you for your ongoing support and trust. We are determined to do everything we can to provide you continued income growth and strong investment returns going forward.
Sincerely,
The Bristol Gate Team
Important disclosures
There is a risk of loss inherent in any investment; past performance is not indicative of future results. Prospective and existing investors in Bristol Gate’s pooled funds or ETF funds should refer to the fund’s offering documents which outline the risk factors associated with a decision to invest. Separately managed account clients should refer to disclosure documents provided which outline risks of investing. Pursuant to SEC regulations, a description of risks associated with Bristol Gate’s strategies is also contained in Bristol Gate’s Form ADV Part 2A located at www.bristolgate.com/regulatory-documents.
US Equity Strategy returns in this report refer to the Bristol Gate US Equity Strategy Composite (the “Composite”). The Composite consists of equities of publicly traded, dividend paying US companies. The Composite is valued in US Dollars and for comparison purposes is measured against the S&P 500 Total Return Index. The composite’s Investment Advisor, Bristol Gate Capital Partners Inc., defines itself as a portfolio manager, exempt market dealer and investment fund manager (as per its registration in Ontario, its principal regulator in Canada) and is also a Registered Investment Adviser with the U.S. Securities and Exchange Commission (the “SEC”). The Investment Advisor’s objective is to select companies with positive dividend growth, and which collectively will generate over the long term a growing income and capital appreciation for investors. The inception date of the Composite is May 15, 2009. The US Dollar is the currency used to measure performance, which is presented on a gross and net basis and includes the reinvestment of investment income. The composite’s gross return is gross of withholding tax prior to January 1, 2017 and is net of withholding tax thereafter. Net returns are calculated by reducing the gross returns by the maximum management fee charged by Bristol Gate of 1%, applied monthly. Actual investment advisory fees incurred by clients may vary. There is the opportunity for the use of leverage up to 30% of the net asset value of the underlying investments using a margin account at the prime broker. Thus far no material leverage has been utilized. An investor’s actual returns may be reduced by management fees, performance fees, and other operating expenses that may be incurred because of the management of the composite. A performance fee may also be charged on some accounts and funds managed by the firm. Bristol Gate claims compliance with the Global Investment Performance Standards (GIPS®). GIPS® is a registered trademark of CFA Institute. CFA Institute does not endorse or promote this organization, nor does it warrant the accuracy or quality of the content contained herein. To obtain a GIPS Composite Report, please email us at info@bristolgate.com.
The S&P 500® Total Return Index measures the performance of the broad US equity market, including dividend re-investment, in US dollars. This index is provided for information only and comparisons to the index has limitations. The benchmark is an appropriate standard against which the performance of the strategy can be measured over longer time periods as it represents the primary investment universe from which Bristol Gate selects securities. However, Bristol Gate’s portfolio construction process differs materially from that of the benchmark and the securities selected for inclusion in the strategy are not influenced by the composition of the benchmark. For example, the strategy is a concentrated portfolio of approximately equally weighted dividend-paying equity securities, rebalanced quarterly whereas the benchmark is a broad stock index (including both dividend and non-dividend paying equities) that is market capitalization weighted. As such, strategy performance deviations relative to the benchmark may be significant, particularly over shorter time periods. The strategy has concentrated investments in a limited number of companies; as a result, a change in one security’s value may have a more significant effect on the strategy’s value.
SPDR® S&P 500® ETF Trust (SPY US) sourced from Bloomberg has been used as a proxy for the S&P 500® Total Return Index for the purpose of providing non-return based portfolio statistics and sector weightings in this report. SPY US is an ETF that seeks to provide investment results that, before expenses, correspond generally to the price and yield performance of the S&P 500® Index.
Canadian Equity Strategy returns in this report refer to the Bristol Gate Canadian Equity Strategy Composite (the “Composite”). The Composite consists primarily of equities of publicly traded, dividend paying Canadian companies. The Composite is valued in Canadian Dollars and for comparison purposes is measured against the S&P/TSX. The composite’s Investment Advisor, Bristol Gate Capital Partners Inc., defines itself as a portfolio manager, exempt market dealer and investment fund manager (as per its registration in Ontario, its principal regulator in Canada) and is also a Registered Investment Adviser with the U.S. Securities and Exchange Commission (the “SEC”). The Investment Advisor’s objective is to select companies primarily from the S&P/TSX universe with positive dividend growth and which collectively will generate over the long term a growing income and capital appreciation for investors. The inception date of the Composite is July 1, 2013. Returns are presented gross and net of fees and include the reinvestment of all income. The composite’s gross return is gross of withholding tax prior to January 1, 2017 and is net of withholding tax thereafter. Net returns are calculated by reducing the gross returns by the maximum management fee charged by Bristol Gate of 0.7%, applied monthly. Actual investment advisory fees incurred by clients may vary. An investor’s actual returns may be reduced by management fees, performance fees, and other operating expenses that may be incurred because of the management of the composite. A performance fee may be charged on some accounts and funds managed by the firm. Bristol Gate claims compliance with the Global Investment Performance Standards (GIPS®). GIPS® is a registered trademark of CFA Institute. CFA Institute does not endorse or promote this organization, nor does it warrant the accuracy or quality of the content contained herein. To obtain a GIPS Composite Report, please email us at info@bristolgate.com.
The returns have been converted into Canadian Dollars using month‐end Bank of Canada Closing rates.
The S&P/TSX Total Return Index measures the performance of the broad Canadian equity market, including dividend re-investment, in Canadian dollars. This index has been provided for information only and comparisons to the index has limitations. The benchmark is an appropriate standard against which the performance of the strategy can be measured over longer time periods as it represents the primary investment universe from which Bristol Gate selects securities. However, Bristol Gate’s portfolio construction process differs materially from that of the benchmark and the securities selected for inclusion in the strategy are not influenced by the composition of the benchmark. For example, the strategy is a concentrated portfolio of approximately equally weighted dividend-paying equity securities, rebalanced quarterly whereas the benchmark is a broad stock index (including both dividend and non-dividend paying equities) that is market capitalization weighted. As such, strategy performance deviations relative to the benchmark may be significant, particularly over shorter time periods. The strategy has concentrated investments in a limited number of companies; as a result, a change in one security’s value may have a more significant effect on the strategy’s value.
iShares Core S&P®/TSX® Capped Composite Index ETF (XIC CN) sourced from Bloomberg has been used as a proxy for the S&P®/TSX® Total Return Index for the purpose of providing non-return based portfolio statistics and sector weightings in this report. XIC CN is an ETF that seeks long-term capital growth by replicating the performance of the S&P®/TSX® Capped Composite Index, net of expenses.
This Report is for information purposes and should not be construed under any circumstances as a public offering of securities in any jurisdiction in which an offer or solicitation is not authorized. Prospective investors in Bristol Gate’s pooled funds or ETF funds should rely solely on the fund’s offering documents, which outline the risk factors associated with a decision to invest. No representations or warranties of any kind are intended or should be inferred with respect to the economic return or the tax implications of any investment in a Bristol Gate fund.
This piece is presented for illustrative and discussion purposes only. It should not be considered as personal investment advice or an offer or solicitation to buy and/or sell securities and it does not consider unique objectives, constraints, or financial needs of the individual. Under no circumstances does this piece suggest that you should time the market in any way or make investment decisions based on the content. Investors are advised that their investments are not guaranteed, their values change frequently, and past performance may not be repeated. References to specific securities are presented to illustrate the application of our investment philosophy only, do not represent all of the securities purchased, sold or recommended for the portfolio, and it should not be assumed that investments in the securities identified were or will be profitable and should not be considered recommendations by Bristol Gate Capital Partners Inc. A full list of security holdings is available upon request. For more information contact Bristol Gate Capital Partners Inc. directly. The information contained in this piece is the opinion of Bristol Gate Capital Partners Inc. and/or its employees as of the date of the piece and is subject to change without notice. Every effort has been made to ensure accuracy in this piece at the time of publication; however, accuracy cannot be guaranteed. Market conditions may change and Bristol Gate Capital Partners Inc. accepts no responsibility for individual investment decisions arising from the use of or reliance on the information contained herein. We strongly recommend you consult with a financial advisor prior to making any investment decisions. Please refer to the Legal section of Bristol Gate’s website for additional information at bristolgate.com.
A Note About Forward-Looking Statements
This report may contain forward-looking statements including, but not limited to, statements about the Bristol Gate strategies, risks, expected performance and condition. Forward-looking statements include statements that are predictive in nature, that depend upon or refer to future events and conditions or include words such as “may”, “could”, “would”, “should”, “expect”, “anticipate”, “intend”, “plan”, “believe”, “estimate” and similar forward-looking expressions or negative versions thereof.
These forward-looking statements are subject to various risks, uncertainties and assumptions about the investment strategies, capital markets and economic factors, which could cause actual financial performance and expectations to differ materially from the anticipated performance or other expectations expressed. Economic factors include, but are not limited to, general economic, political and market factors in North America and internationally, interest and foreign exchange rates, global equity and capital markets, business competition, technological change, changes in government regulations, unexpected judicial or regulatory proceedings, and catastrophic events.
Readers are cautioned not to place undue reliance on forward-looking statements and consider the above-mentioned factors and other factors carefully before making any investment decisions. All opinions contained in forward-looking statements are subject to change without notice and are provided in good faith. Forward-looking statements are not guarantees of future performance, and actual results could differ materially from those expressed or implied in any forward-looking statements. Bristol Gate Capital Partners Inc. has no specific intention of updating any forward-looking statements whether as a result of new information, future events or otherwise, except as required by securities legislation.
 Takes 2 minutes