
Performance Summary
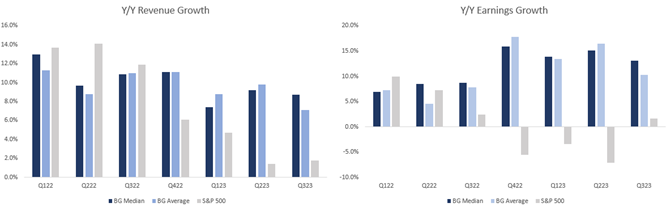
During the quarter, both the US Equity Strategy and Canadian Equity Strategy outperformed their respective benchmarks net of fees. Both the strategies also continued to outpace their respective benchmarks in terms of dividend growth.
For the full year, the US Equity strategy kept pace with the S&P 500 in a very narrow market, while our Canadian Equity strategy had a strong year relative to the S&P/TSX Composite. For a more detailed discussion on performance see each Strategy’s respective section below.
Portfolio Dividend Growth – Trailing and consensus forward 12 months.
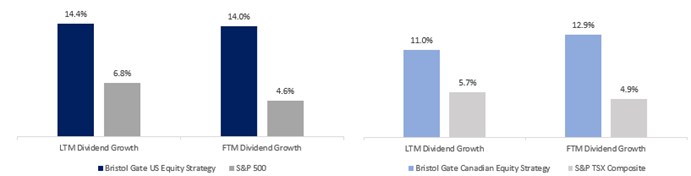
Note: Last 12 months (“LTM”) Dividend Growth is the median of the actual trailing 12-month dividend growth of the individual stocks held by Strategies or Index constituents as reported by Bloomberg as at Dec 31, 2023. Forward 12 months (“FTM”) Dividend Growth is the median of the Bristol Gate Model’s forward 12-month prediction for the individual stocks held by the Strategies and the median of consensus estimates for the constituents of the Indices as of quarter end. Companies without a consensus dividend forecast were excluded. Return commentary based on gross returns.
Source: Bloomberg, FactSet, Bristol Gate Capital Partners.
Trust the Process
A year ago, the S&P 500 had just experienced its worst year since the Global Financial Crisis. There were widespread concerns that high interest rates and inflation would lead to a recession and that markets would continue to suffer as a result. Suffice it to say, in 2023 the market zigged while most expected it to zag. The S&P 500 finished the year up over 26%.
In our 2022 year-end client letter, following the challenging year, we counseled that investors zoom out and focus on the bigger picture. We wrote:
From our perspective, times like these offer attractive opportunities for long-term investors. Valuations have been reset. Inflation, while persistent, appears to have peaked. The Fed is likely closer to the end of the hiking cycle than the beginning. An economic recession sometime in 2023 has become a consensus view and markets have already discounted some of that. Although we continue to believe 2023 consensus expectations for double digit earnings growth for the broader market look optimistic considering slowing economic growth and rising costs, we are not investing in the entire market. We are looking for 22 companies that can grow their dividends at
above average rates on the back of solid underlying fundamentals. Our disciplined process and philosophy aim to eliminate the noise market volatility creates and instead take advantage of it. There is a broader offering of investment opportunities available at more attractive valuations than existed a year ago, and we enter the new year enthusiastic about the future for our clients.
Much like Sam Hinkie and his rebuild of the Philadelphia 76ers, we asked investors to “trust the process”, not the outcome after a difficult 2022. That trust was seemingly rewarded in 2023.
In an environment of slow growth and the relative return headwind from not owning six of the “Magnificent Seven” stocks (either due to no dividend payments or subpar dividend growth), our portfolio and the companies within it have distinguished themselves through their better operating results than their dividend peers and having experienced much less multiple expansion and/or much better operating performance than the market.
Exhibit 1. 2023 Returns.
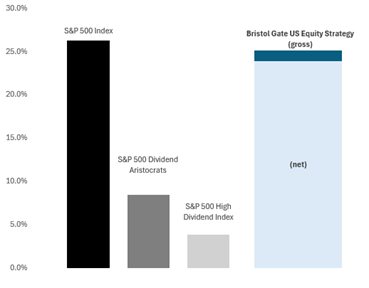
Source: Bristol Gate Capital Partners, Morningstar Direct.
While we are proud of our results in 2023, we never put too much stock in short term returns. How our strategy performs over the long-term matters much more. From that perspective, our formula has worked for almost 15 years now. As Exhibit 2 shows, over that time frame, our high dividend growth focus has consistently performed at the top relative to our peer group of dividend and income strategies and produced results that have been competitive with the Index across various time periods. We have achieved this despite not being able to own many of the non dividend paying tech and tech related companies that have created so much value in the Index over the past 15 years.
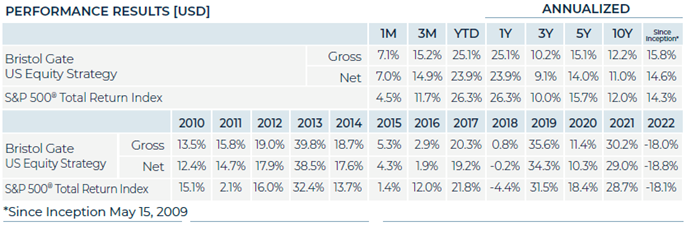
Exhibit 2. Returns Over Various Time Periods
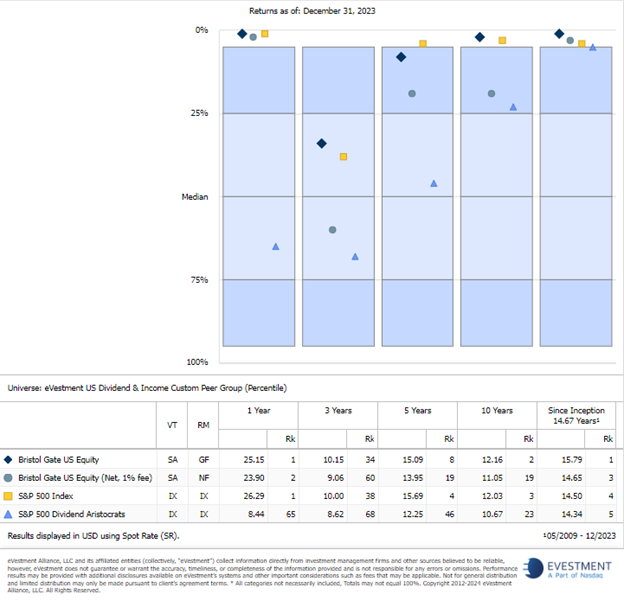
Note: The eVestment US Dividend & Income Peer Group is a custom universe we have created based on a review of long-only dividend and/or equity income focused US large-cap strategies within the eVestment database. Bristol Gate Capital Partners Inc. pays a licensing fee to eVestment to access their database. As at Jan 16, 2024.
We believe our long-term track record is a testament to our differentiated approach to dividend investing, taking advantage of structural market inefficiencies and using our investment process to create a competitive advantage.
We are singularly focused on high and sustainable dividend growth.
Everything we do is centered around high dividend growth and the underlying factors that can maintain it. In 2023, our portfolio companies delivered dividend increases of ~14%, well above the Index constituent average increase of ~7% and the actual S&P 500 Index cash dividend increase of less than 5%.
Exhibit 3. Trailing 12 Month Dividend Growth
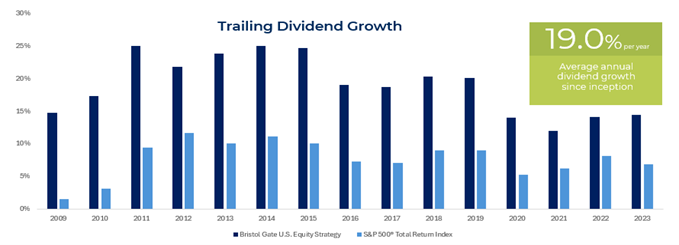
Note: As at December 31, 2023. Trailing dividend growth is median of the annual trailing 12-month dividend growth (as reported on Bloomberg) of the individual stocks held at the end of each calendar year.
Source: Bloomberg, Bristol Gate Capital Partners.
We are yield agnostic and do not compromise on quality.
Rather than requiring a minimum yield, our focus on high dividend growth as opposed to high dividend yield is a key differentiator that we believe leads to better long-term results. Often companies that are paying high yields do so in an unsustainable manner, with excessive payout ratios or dividend payments propped up with the use of leverage. We ignore those companies and instead focus on the ones that have low payout ratios, low leverage, who share a little bit of the strong cash flow they generate with us as investors, but more importantly, reinvest the bulk of it back into their businesses to drive that cash flow and dividend higher over time.
Exhibit 4. Bristol Gate’s Focus
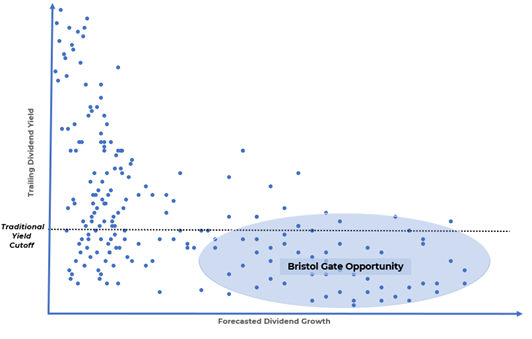
Source: Bristol Gate Capital Partners.
Our process demands conviction.
We are not trying to be everything to everyone. We are looking for 22 stocks that meet our stringent requirements and we give each of them an equal weight in our portfolio. When those stocks exceed certain threshold weights, they are automatically rebalanced back to target weight on a quarterly basis.
That automatic rebalancing is an inherently contrarian mechanism within our process that has several positive outcomes. It allows us to stick with our winners over a long period of time without them becoming a big portfolio risk in themselves. It allocates to our laggards during periods when they are out of favour, increasing the internal rate of return on those investments versus a buy and hold strategy. Lastly, and perhaps most importantly, if forces us to have an honest conversation with ourselves when a holding is not meeting our expectations and decide if it deserves to remain in the portfolio or not.
Exhibit 5. Bristol Gate Rebalancing Approach
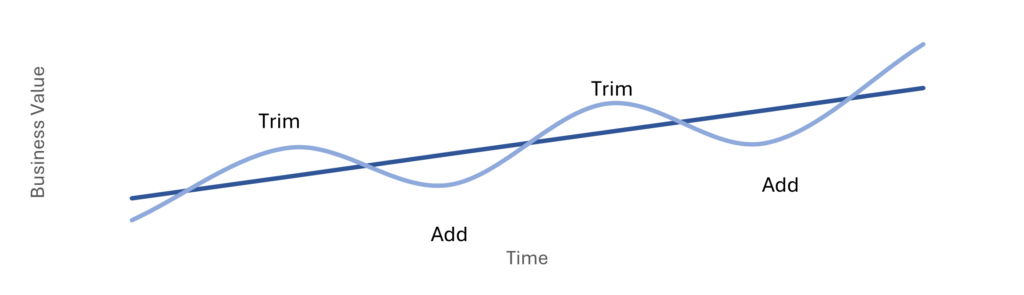
Source: Bristol Gate Capital Partners
We look to continuously improve our process.
We are not dogmatic about our process and critically evaluate each element of what we do in hopes of identifying a better way and improving our return potential. Our firm embraced machine learning in 2017, long before OpenAI’s Chat GPT made Artificial Intelligence a buzz word. We did so because it improved our chances of success by producing more accurate dividend growth predictions than the model we were using at the time. We are currently working on a number of projects across stock selection, portfolio construction and trading that we hope will be additive to our return opportunity in the future.
Summary
This coming year will see our US Equity Strategy reach the milestone of a 15-year track record. Over that timeframe, our process has withstood a variety of economic environments, whether it be falling or rising interest rates, economic expansion or contraction, geopolitical events, and a global pandemic. We continue not to guess where the macro environment is heading and instead trust our process. We remain confident that whatever the coming year may have in store for us, our clients and partners will benefit from our approach over the long term. Our approach is unchanged: build a portfolio of high-quality companies that can grow their dividends at high rates and buy them at reasonable prices. That strategy has served our investors well, and their dividend income has also risen substantially. We do not see why the factors that led to that performance should change in the future and look forward to continuing to compound our investors income and wealth.
US Equity Strategy
Source: Bristol Gate Capital Partners. There is a risk of loss inherent in any investment; past performance is not indicative of future results. Please see important disclosures at end of document.
Market Recap:
After declining in the third quarter, the S&P 500 closed out the year with a strong Q4, rising by over 11%. The rally was underpinned by inflation easing and the Federal Reserve signaled it could start cutting interest rates in 2024 if inflation continued to fall.
From a fundamental perspective, earnings growth continues to be slow for the broad market with FactSet forecasting flat earnings y/y for the S&P 500 in Q4/23. This is expected to accelerate to 11.4% in 2024. The brighter outlook, combined with a more dovish Fed led to wider breadth in the market. After being driven by a handful of stocks for the first nine months of the year, the last quarter was the only one in 2023 where the equal-weighted S&P 500 outperformed the market-cap weighted index.
Portfolio Results:
The US Equity strategy outperformed the benchmark during the quarter net of fees. For the year, the portfolio underperformed the S&P 500, although it performed very well relative to our investable universe of dividend-paying stocks.
Contributors:
Both overweight and stock selection in Industrials, stock selection in Information Technology and no exposure to Energy contributed to the portfolio’s outperformance.
On an absolute basis, Broadcom, American Tower and Cintas were amongst our best performers in the quarter.
For the year, stock selection in Financials contributed to returns. The portfolio benefited by having no exposure to Energy and Utilities and both allocation and selection effects in Health Care and Industrials also contributed to returns.
Detractors:
Stock selection in Consumer Discretionary and both overweight and stock selection in Materials detracted from returns in the quarter.
On an absolute basis, Corteva, Activision Blizzard and UnitedHealth Group were among the weakest performers.
For the year, the largest detractor was not owning six out of the “Magnificent Seven” group of companies, as they either did not pay a dividend or meet our criteria for dividend growth. Stock selection in Consumer Discretionary and Consumer Staples detracted from returns, as did allocation and selection effects in Communication Services and Materials.
Transactions:
During the quarter, with the cash received from Microsoft’s acquisition of Activision Blizzard in October, we initiated a new position in Carrier Global Corporation at a 4.5% weight and increased our positions in Thermo Fisher Scientific, Sherwin-Williams and Lowe’s back to target weight.
Carrier is a leading global provider of Heating, Ventilation and Air Conditioning (HVAC) and refrigeration solutions. We believe the business is positioned to deliver attractive dividend growth supported by solid underlying fundamentals.
HVAC is an attractive industry, historically growing at two times the rate of industrial production, fueled by long-term sustainability megatrends and a growing global middle class. The industry enjoys the benefits of a significant portion of its revenues coming from repair and replacement activities, buffering sales relative to other industrial segments during periods of economic weakness. Lastly, Carrier is trading at a meaningful discount to its HVAC peers, a valuation gap we expect to close as it becomes more of a pure play HVAC company, exiting certain non-HVAC businesses and integrating its acquisition of Viessmann Climate Solutions, a European heat pump business.
In this regard, management recently announced agreements to sell its global commercial refrigeration business to Haier for an enterprise value of approximately $800 million and its security business to Honeywell for an enterprise value of approximately $5 billion. The sales prices represented transaction multiples of 16.5x and approximately 17x 2023 expected EBITDA, respectively and were comfortably above our expectations, indicating the value in Carrier’s portfolio.
The proceeds from the disposition will help the company pay down debt from their Viessmann deal and reach their committed leverage target quicker, allowing them to resume share buybacks.
Outlook:
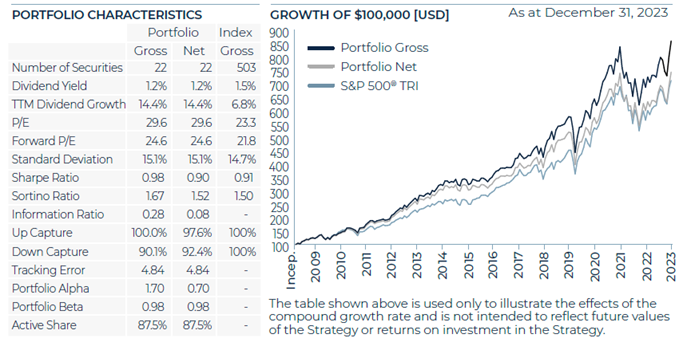
In an environment of slow growth and the relative return headwind from not owning six of the “Magnificent Seven” stocks (either due to no dividend payments or subpar dividend growth), our portfolio companies have distinguished themselves through their operating results.
Exhibit 7. Bristol Gate US Equity Portfolio Metrics vs S&P 500 Index
Source: Bristol Gate Capital Partners, Bloomberg
The entire market’s gain for 2023 can be attributed to multiple expansion as earnings are expected to be down for 2023. In contrast, our collection of high dividend growth, high quality businesses experienced significantly less multiple expansion than the market, accounting for less than a third of our return for the year. Said another way, relative to the market, we believe consensus expectations have set the operating hurdle for 2024 much lower for our holdings. If they continue operating as they have, and we see no reason for that to change, it should result in a good outcome for our investors. The broad market on the other hand must deliver a significant increase in earnings to justify the multiple expansion it was awarded in 2023.
Canadian Equity Strategy
Source: Bristol Gate Capital Partners. There is a risk of loss inherent in any investment; past performance is not indicative of future results. Please see important disclosures at end of document.
Market Recap:
The S&P/TSX Composite rose over 8% in the quarter. After GDP contracted in the third quarter, the Bank of Canada maintained their policy rates during Q4 to try and continue to support domestic growth.
Portfolio Results:
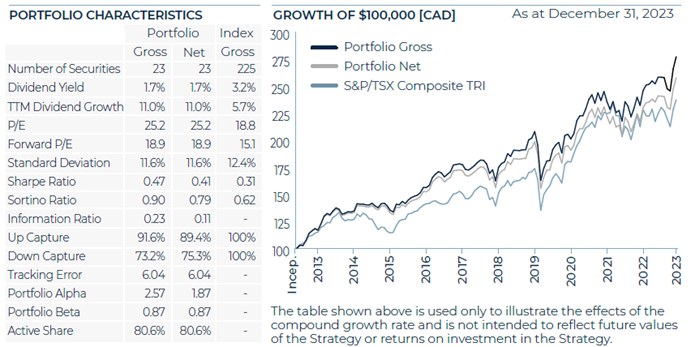
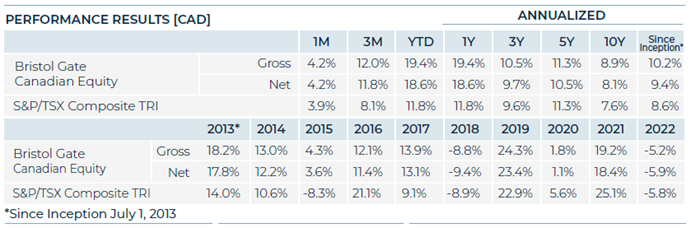
The Canadian Equity strategy outperformed the benchmark during the quarter and added considerable value above the benchmark for the year. We view the long-term results of the strategy relative to the S&P/TSX Composite as validation that a high-quality portfolio of high dividend growth stocks can outperform the market over the long-term.
Contributors:
Having no exposure to the Energy sector as well as both selection and allocation effects in Materials, Consumer Staples and Real Estate contributed to the portfolio’s outperformance.
On an absolute basis, Jamieson Wellness, Colliers International and Brookfield were amongst our best performers in the quarter.
For the year, the portfolios underweight to and stock selection within the Materials sector, stock selection in Real Estate and Financials and the lack of exposure to the Energy sector were the primary contributors to outperformance.
Detractors:
The underweight to Financials, and stock selection in the Information Technology sector detracted from returns in the quarter.
On an absolute basis, Premium Brands Holdings, Dollarama and Intact Financial were among the weakest performers.
For the year, stock selection in Information Technology was the largest detractor from returns.
Transactions:
There were no material transactions for the Canadian strategy in Q4.
Firm Update
During the past year we continued to make progress at the firm level by welcoming back Vincent Racine to the Data Science Team and Aman Dhaliwal to the Sales and Marketing Team. Both had been co-op students with us in the past and after completing their degrees decided to return to Bristol Gate. We are delighted with their decisions.
On the business side we had a busy and productive year and were successful earning the right to be represented on a couple of significant SMA platforms at major distribution firms in Canada. We have increased our efforts in the US by contracting with 2 separate firms to represent us there and we hope to have continued success in both markets moving forward.
To all our clients, thank you for your ongoing support and trust. We are determined to do everything we can to provide you income growth and strong investment returns in the future.
Sincerely, The Bristol Gate Team
Important disclosures
There is a risk of loss inherent in any investment; past performance is not indicative of future results. Prospective and existing investors in Bristol Gate’s pooled funds or ETF funds should refer to the fund’s offering documents which outline the risk factors associated with a decision to invest. Separately managed account clients should refer to disclosure documents provided which outline risks of investing. Pursuant to SEC regulations, a description of risks associated with Bristol Gate’s strategies is also contained in Bristol Gate’s Form ADV Part 2A located at www.bristolgate.com/regulatory-documents.
US Equity Strategy returns in this report refer to the Bristol Gate US Equity Strategy Composite (the “Composite”). The Composite consists of equities of publicly traded, dividend paying US companies. The Composite is valued in US Dollars and for comparison purposes is measured against the S&P 500 Total Return Index. The composite’s Investment Advisor, Bristol Gate Capital Partners Inc., defines itself as a portfolio manager, exempt market dealer and investment fund manager (as per its registration in Ontario, its principal regulator in Canada) and is also a Registered Investment Adviser with the U.S. Securities and Exchange Commission (the “SEC”). The Investment Advisor’s objective is to select companies with positive dividend growth, and which collectively will generate over the long term a growing income and capital appreciation for investors. The inception date of the Composite is May 15, 2009. The US Dollar is the currency used to measure performance, which is presented on a gross and net basis and includes the reinvestment of investment income. The composite’s gross return is gross of withholding tax prior to January 1, 2017 and is net of withholding tax thereafter. Net returns are calculated by reducing the gross returns by the maximum management fee charged by Bristol Gate of 1%, applied monthly. Actual investment advisory fees incurred by clients may vary. There is the opportunity for the use of leverage up to 30% of the net asset value of the underlying investments using a margin account at the prime broker. Thus far no material leverage has been utilized. An investor’s actual returns may be reduced by management fees, performance fees, and other operating expenses that may be incurred because of the management of the composite. A performance fee may also be charged on some accounts and funds managed by the firm. Bristol Gate claims compliance with the Global Investment Performance Standards (GIPS®). GIPS® is a registered trademark of CFA Institute. CFA Institute does not endorse or promote this organization, nor does it warrant the accuracy or quality of the content contained herein. To obtain a GIPS Composite Report, please email us at info@bristolgate.com.
The S&P 500® Total Return Index measures the performance of the broad US equity market, including dividend re-investment, in US dollars. This index is provided for information only and comparisons to the index has limitations. The benchmark is an appropriate standard against which the performance of the strategy can be measured over longer time periods as it represents the primary investment universe from which Bristol Gate selects securities. However, Bristol Gate’s portfolio construction process differs materially from that of the benchmark and the securities selected for inclusion in the strategy are not influenced by the composition of the benchmark. For example, the strategy is a concentrated portfolio of approximately equally weighted dividend-paying equity securities, rebalanced quarterly whereas the benchmark is a broad stock index (including both dividend and non-dividend paying equities) that is market capitalization weighted. As such, strategy performance deviations relative to the benchmark may be significant, particularly over shorter time periods. The strategy has concentrated investments in a limited number of companies; as a result, a change in one security’s value may have a more significant effect on the strategy’s value.
S&P 500 ® Total Return Dividend Aristocrats Index measures the performance of a subset of S&P 500® Index companies that have increased their dividends every year for the last 25 consecutive years. This Index has limited relevancy to our approach as it focuses on historical dividend growth, whereas Bristol Gate’s US Equity strategy’s securities are selected based on future dividend growth.
S&P 500 ® High Dividend Index is designed to measure the performance of 80 high yield companies within the S&P 500 and is equally weighted to best represent the performance of this group, regardless of constituent size. This Index has
limited relevancy to our approach as it focuses on dividend yield, whereas Bristol Gate’s US Equity strategy’s securities are selected based on future dividend growth.
SPDR® S&P 500® ETF Trust (SPY US) sourced from Bloomberg has been used as a proxy for the S&P 500® Total Return Index for the purpose of providing non-return-based portfolio statistics and sector weightings in this report. SPY US is an ETF that seeks to provide investment results that, before expenses, correspond generally to the price and yield performance of the S&P 500® Index.
Canadian Equity Strategy returns in this report refer to the Bristol Gate Canadian Equity Strategy Composite (the “Composite”). The Composite consists primarily of equities of publicly traded, dividend paying Canadian companies.
The Composite is valued in Canadian Dollars and for comparison purposes is measured against the S&P/TSX. The composite’s Investment Advisor, Bristol Gate Capital Partners Inc., defines itself as a portfolio manager, exempt market dealer and investment fund manager (as per its registration in Ontario, its principal regulator in Canada) and is also a Registered Investment Adviser with the U.S. Securities and Exchange Commission (the “SEC”). The Investment Advisor’s objective is to select companies primarily from the S&P/TSX universe with positive dividend growth and which collectively will generate over the long term a growing income and capital appreciation for investors. The inception date of the Composite is July 1, 2013. Returns are presented gross and net of fees and include the reinvestment of all income. The composite’s gross return is gross of withholding tax prior to January 1, 2017 and is net of withholding tax thereafter. Net returns are calculated by reducing the gross returns by the maximum management fee charged by Bristol Gate of 0.7%, applied monthly. Actual investment advisory fees incurred by clients may vary. An investor’s actual returns may be reduced by management fees, performance fees, and other operating expenses that may be incurred because of the management of the composite. A performance fee may be charged on some accounts and funds managed by the firm. Bristol Gate claims compliance with the Global Investment Performance Standards (GIPS®). GIPS® is a registered trademark of CFA Institute. CFA Institute does not endorse or promote this organization, nor does it warrant the accuracy or quality of the content contained herein. To obtain a GIPS Composite Report, please email us at info@bristolgate.com.
The returns have been converted into Canadian Dollars using month‐end Bank of Canada Closing rates.
The S&P/TSX Total Return Index measures the performance of the broad Canadian equity market, including dividend re-investment, in Canadian dollars. This index has been provided for information only and comparisons to the index has limitations. The benchmark is an appropriate standard against which the performance of the strategy can be measured over longer time periods as it represents the primary investment universe from which Bristol Gate selects securities. However, Bristol Gate’s portfolio construction process differs materially from that of the benchmark and the securities selected for inclusion in the strategy are not influenced by the composition of the benchmark. For example, the strategy is a concentrated portfolio of approximately equally weighted dividend-paying equity securities, rebalanced quarterly whereas the benchmark is a broad stock index (including both dividend and non-dividend paying equities) that is market capitalization weighted. As such, strategy performance deviations relative to the benchmark may be significant, particularly over shorter time periods. The strategy has concentrated investments in a limited number of companies; as a result, a change in one security’s value may have a more significant effect on the strategy’s value.
iShares Core S&P®/TSX® Capped Composite Index ETF (XIC CN) sourced from Bloomberg has been used as a proxy for the S&P®/TSX® Total Return Index for the purpose of providing non-return-based portfolio statistics and sector weightings in this report. XIC CN is an ETF that seeks long-term capital growth by replicating the performance of the S&P®/TSX® Capped Composite Index, net of expenses.
This Report is for information purposes and should not be construed under any circumstances as a public offering of securities in any jurisdiction in which an offer or solicitation is not authorized. Prospective investors in Bristol Gate’s pooled funds or ETF funds should rely solely on the fund’s offering documents, which outline the risk factors associated
with a decision to invest. No representations or warranties of any kind are intended or should be inferred with respect to the economic return or the tax implications of any investment in a Bristol Gate fund.
This piece is presented for illustrative and discussion purposes only. It should not be considered as personal investment advice or an offer or solicitation to buy and/or sell securities and it does not consider unique objectives, constraints, or financial needs of the individual. Under no circumstances does this piece suggest that you should time the market in any way or make investment decisions based on the content. Investors are advised that their investments are not guaranteed, their values change frequently, and past performance may not be repeated. References to specific securities are presented to illustrate the application of our investment philosophy only, do not represent all of the securities purchased, sold or recommended for the portfolio, and it should not be assumed that investments in the securities
identified were or will be profitable and should not be considered recommendations by Bristol Gate Capital Partners Inc. A full list of security holdings is available upon request. For more information contact Bristol Gate Capital Partners Inc. directly. The information contained in this piece is the opinion of Bristol Gate Capital Partners Inc. and/or its employees as of the date of the piece and is subject to change without notice. Every effort has been made to ensure accuracy in this piece at the time of publication; however, accuracy cannot be guaranteed. Market conditions may change and Bristol Gate Capital Partners Inc. accepts no responsibility for individual investment decisions arising from the use of or reliance on the information contained herein. We strongly recommend you consult with a financial advisor prior to making any investment decisions. Please refer to the Legal section of Bristol Gate’s website for additional information at bristolgate.com.
A Note About Forward-Looking Statements
This report may contain forward-looking statements including, but not limited to, statements about the Bristol Gate strategies, risks, expected performance and condition. Forward-looking statements include statements that are predictive in nature, that depend upon or refer to future events and conditions or include words such as “may”, “could”, “would”, “should”, “expect”, “anticipate”, “intend”, “plan”, “believe”, “estimate” and similar forward-looking expressions or negative versions thereof.
These forward-looking statements are subject to various risks, uncertainties and assumptions about the investment strategies, capital markets and economic factors, which could cause actual financial performance and expectations to differ materially from the anticipated performance or other expectations expressed. Economic factors include, but are not limited to, general economic, political and market factors in North America and internationally, interest and foreign exchange rates, global equity and capital markets, business competition, technological change, changes in government regulations, unexpected judicial or regulatory proceedings, and catastrophic events.
Readers are cautioned not to place undue reliance on forward-looking statements and consider the above-mentioned factors and other factors carefully before making any investment decisions. All opinions contained in forward-looking statements are subject to change without notice and are provided in good faith. Forward-looking statements are not guarantees of future performance, and actual results could differ materially from those expressed or implied in any forward-looking statements. Bristol Gate Capital Partners Inc. has no specific intention of updating any forward-looking statements whether as a result of new information, future events or otherwise, except as required by securities legislation.
 Takes 2 minutes