
Performance Summary
During the quarter, both the US Equity Strategy and Canadian Equity Strategy underperformed their respective benchmarks net of fees. Both the strategies also continued to outpace their respective benchmarks in terms of dividend growth. For a more detailed discussion on performance see each Strategy’s respective section below.
Portfolio Dividend Growth – Trailing and consensus forward 12 months.
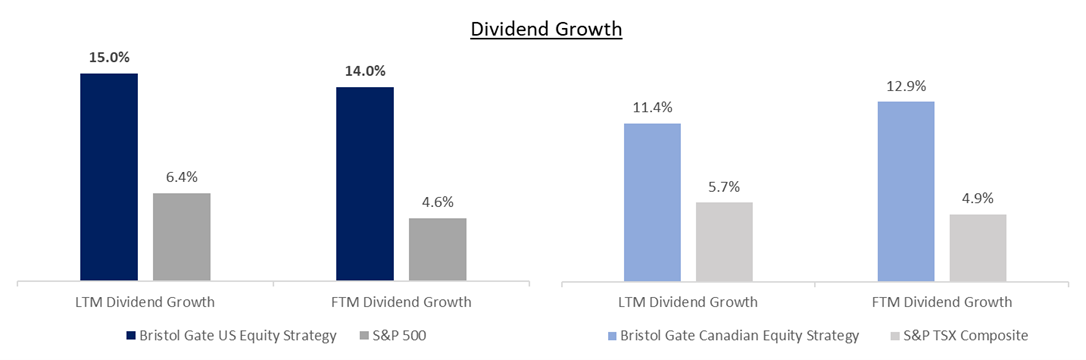
Note: Last 12 months (“LTM”) Dividend Growth is the median of the actual trailing 12-month dividend growth of the individual stocks held by Strategies or Index constituents as reported by Bloomberg as at March 31, 2024. Forward 12 months (“FTM”) Dividend Growth is the median of the Bristol Gate Model’s forward 12-month prediction for the individual stocks held by the Strategies and the median of consensus estimates for the constituents of the Indices as of quarter end. Companies without a consensus dividend forecast were excluded.
Source: Bloomberg, FactSet, Bristol Gate Capital Partners.
“Multiples are not valuation”
When it comes to valuing businesses (or portfolios), we strongly agree with Michael Mauboussin’s statement that “Multiples are not valuation. They are a shorthand for the valuation process. Importantly, multiples obscure the value drivers that investors most care about.” We believe valuations are more nuanced – both at the portfolio and company level – than just dividing price by earnings.
The P/E ratio is possibly the most used measure to gauge the valuation of a stock. It represents the amount an investor is paying for each dollar of earnings. The higher the ratio, the more expensive a stock is relative to its earnings.
When evaluating investment options, we believe comparing P/E ratios in a vacuum can result in suboptimal outcomes. We suspect some of the relative performance challenges certain investors have faced over the past decade are due to focusing too much on the absolute ratio and not enough on the underlying nuances that drive differences in P/E ratios.
At the portfolio level, factors such as the composition versus the Index in terms of sector weights and the mix of cyclical versus defensive stocks can have an impact. At the company level, growth and the sustainability of returns on capital supported by the durability of competitive advantages can impact valuation.
It is commonly understood that the value of a business is the sum of its future discounted cash flows (DCF). Perhaps the most well-known and easiest to calculate DCF is the Gordon Growth Model (GGM), named after Myron Gordon who published a paper on it in 1956. Professor Gordon showed how the price of a business (P) is determined by the dividend in the upcoming year (D1), the future growth rate of that dividend (g) and the investor’s required rate of return (r):

Although the model has certain limitations, you can understand our affinity for it given its simplicity, eloquence, and our focus on dividend growth. Its principles underly our conceptual return framework.
Exhibit 1: Bristol Gate Conceptual Return Framework
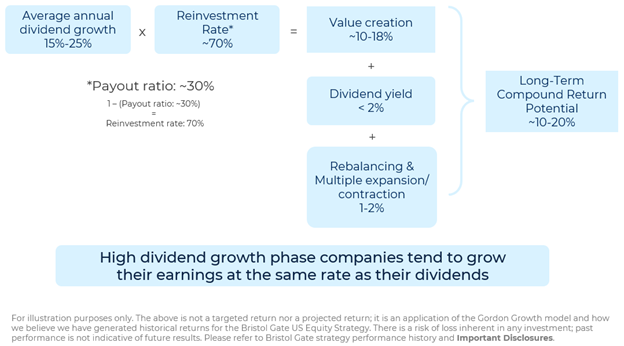
Source: Bristol Gate Capital Partners
Assuming an investor has a 15% return requirement and applying the GGM to two companies, both paying a $1 dividend per share today, but Company A is expected to grow its dividend sustainably at 10% and Company B is expected to grow its dividend sustainably at 5%, we can see the effect dividend growth has on valuation:

The company with the faster growth, Company A, is approximately two times more valuable than Company B.
However, growth requires investment. The more you need to invest to drive growth, the less you have left to payout to investors. Therefore, it is not just the growth that matters but the amount of capital needed to sustain that growth. A business generating 15% returns for every dollar invested in it should be more valuable than a business generating 5% returns on the same dollar of investment, all else being equal.
Extending the above analysis to show the effect returns on invested capital (ROIC) have on valuation, let’s again assume we have two companies. This time we will call them Company Y and Company Z. Today, both produce $2 in earnings and pay a dividend per share of $1, implying an initial payout ratio of 50%. For every dollar invested in the business, Company Y earns a 30% return whereas Company Z produces a 10%. Under these assumptions, Company Y can grow its dividend 15% annually while company Z is only able to grow its dividend at a 5% rate ((1-payout ratio = reinvestment rate)*ROIC). Higher ROICs support faster dividend growth. As we showed in the previous example of the Gordon Growth Model, higher dividend growth generates higher valuations.
Back to the matter of why it is inadvisable to simply look at valuation through the lens of P/E: You can see from the exhibit below, the concentrated nature of our portfolio and our investment process focusing on the fastest dividend growers for the coming year results in different sector breakdown compared to the Index. It is common for our portfolio to be underweight higher yielding sectors because they typically have lower dividend growth prospects. Those sectors also often happen to trade at below market multiples.
Exhibit 2. Bristol Gate US Equity Sector Weights and P/E Ratios vs. the S&P 500 Index
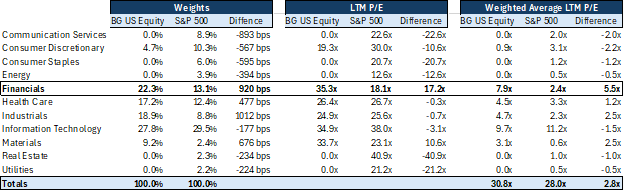
Source: Bristol Gate Capital Partners, Bloomberg. As at 03/31/24.
Dissecting the portfolio’s relative P/E by sector reveals that the variance from the index is largely driven by Financials where we have a large overweight allocation and our holdings trade at a P/E ratio almost two times the Index’s sector constituents.
Now, the question is, is that multiple difference justified? We believe the answer is yes. When compared to the broader Financials sector, we think our holdings have several attributes that support their premium valuation. Our Financial holdings consist of Marsh & McLellan, Mastercard, Moody’s, MSCI and Visa. These companies look quite different to the typical bank or insurance company that make up most of the Financials sector. Unlike the highly regulated banks and insurance industries, the businesses in our portfolio are ‘capital light,’ and they have recurring revenue models and high customer renewal rates. These business models are less influenced by volatile business cycles or interest rate cycles and typically produce more consistent earnings. Our Financial holdings have better profit margins due to their differentiated offerings. They are not selling vanilla financial products; they have unique assets or expertise that customers are willing to pay for.
Exhibit 3 below compares various measures of profitability of our Financials holdings to the sector. They are four to nine times more profitable depending on the measure considered, earning much more per dollar invested in the business than the sector overall. As we demonstrated earlier, higher returning businesses deserve premium valuations.
Exhibit 3: Bristol Gate US Equity Strategy Financials Sector Holdings Return Characteristics
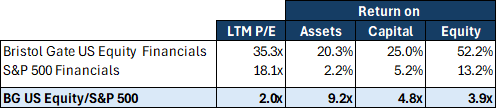
Source: Bristol Gate Capital Partners, Bloomberg. As at 03/31/24
Not all P/E multiples are created equal. Treating them the same without considering the underlying drivers of value can be hazardous to your future wealth creation.
US Equity Strategy
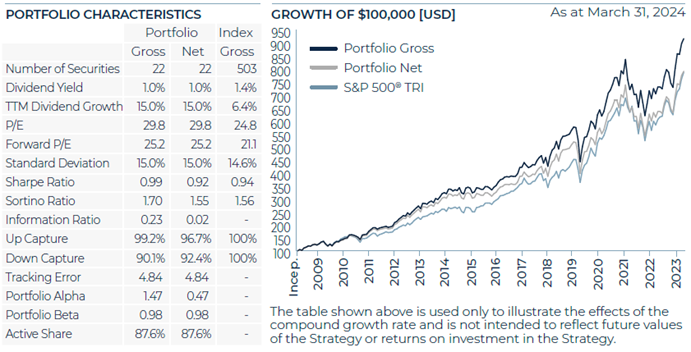
Source: Bristol Gate Capital Partners. There is a risk of loss inherent in any investment; past performance is not indicative of future results. Please see important disclosures at end of document.
Market Recap:
The S&P 500 rose 10.6% during the first quarter as the market continued to ride the wave of the Magnificent Seven stocks to new highs. Corporate earnings remain positive but muted as the Federal Reserve continued to hold interest rates steady and market expectations for a rate cut continue to get pushed out further in the future.
Portfolio Results:
The US Equity strategy underperformed the benchmark in the period.
Contributors:
An underweight to Consumer Discretionary, combined with positive stock selection, an overweight to Materials with strong stock selection, and no exposure to Consumer Staples contributed to relative returns in the period.
On an absolute basis, Applied Materials Inc (AMAT), Corteva Inc (CTVA), and Broadcom Inc (AVGO) were amongst our best performers in the period.
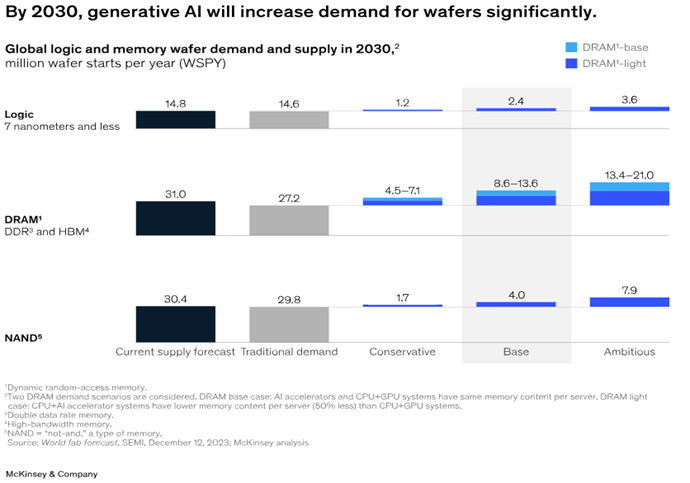
AMAT continues to benefit from ongoing investments by semiconductor manufacturers. A surge of interest in generative AI is leading to higher demand at the leading edge and COVID induced global supply chain challenges are resulting in localized manufacturing investments at the lagging edge. According to McKinsey, by 2030, generative AI alone will significantly increase semiconductor wafer demand, which will in turn translate into more demand for AMAT’s semiconductor manufacturing equipment. When combined with more complex chip designs requiring new materials, innovative technologies, more steps in the chip manufacturing process, an increase in attached services and share gains we believe AMAT can grow revenue in the high single digits in a conservative outlook and mid teens in a more optimistic scenario over that period.
AVGO also benefited from AI. At a recent investor meeting, the company disclosed a third major customer for its custom AI chips, building upon existing relationships with Google and Meta. Management expects AI to account for ~$10 billion of revenue in fiscal 2024, accounting for 35% of its semiconductor segment revenue, compared to ~15% in fiscal 2023. The company’s total semiconductor business has grown 13% annually, organically from $17 billion in fiscal 2019 to $28 billion in fiscal 2023. We expect AI to remain a substantial growth driver going forward as the company highlighted customer AI clusters have grown from 4,000 nodes in 2022 to 30,000 in 2024, with plans to go to one million+ nodes over time, driving demand for both AVGO’s custom AI and networking silicon.
CTVA had a significant rebound following better than expected commentary surrounding its crop protection business and extremely low expectations. While destocking amongst distributors is ongoing, underlying farmer demand remains stable. The company expects a normalization of the crop protection market into fiscal 2025. In the meantime, the company’s seed segment continues to meet our expectations, with potential future upside from recent European Union policy change in favour of gene edited seeds. Gene edited crops had been bucketed along with genetically modified organisms and therefore effectively band throughout most of the EU, however the success of messenger RNA vaccines for COVID-19, the rising threat of climate change to food production, and the war in Ukraine have all worked to shift opinions on new breeding technologies.
Detractors:
Stock selection in the Industrials, Financials, and Health Care sectors detracted from returns in the period. Additionally, the allocation to Health Care also negatively impacted relative performance. Despite being overweight in these sectors, the selections made within Industrials, Financials, and Health Care were not beneficial to the portfolio’s overall returns.
On an absolute basis, Zoetis Inc (ZTS), American Tower Corp (AMT), and UnitedHealth Group Inc (UNH) were amongst the weakest performers in the period.
ZTS fell due to competitive concerns on key franchises like Simparica Trio in parasiticides, and Apoquel and Cytopoint in dermatology as new entrants entered or are expected to enter the markets. We believe the company has several strategies at its disposal to not only defend share but continue growing it, including chewables in Apoquel or longer lasting versions of Cytopoint. In the parasiticide market, less effective treatments like collars retain a large share of the market which we expect to provide continued conversion opportunities for Simparica Trio. Competitive entrants should help grow the segment through increased consumer awareness. In addition to the competition issues, ZTS was pressured by investor concerns regarding the safety of a new osteoarthritis (OA) drug launched in the US called Librela. We believe the safety concerns are overblown as the drug has been in markets outside the US for almost three years now with 11 million doses globally since the launch. Management has reported no unusual trends or signals with its US experience thus far.
AMT, along with the real estate sector overall, was negatively impacted by higher rates. The higher cost of funding and a sizeable amount of debt led to dividend growth predictions below our hurdle rate, which in turn led to the sale of the stock during the quarter.
Often healthcare stocks face challenges during election years as the cost of medical care frequently becomes a political issue, however, UNH also had several discrete challenges that pressured it. In February, the company disclosed a massive data breach at its Change Healthcare unit impacting its electronic prescribing, payment and medical claims platforms. The company has been aggressively working to restore its systems and launched a Temporary Funding Assistance Program to ensure healthcare providers impacted by the hack could bridge their cash flow needs until systems were restored. While work continues, we believe this will prove to be a temporary impediment. In addition to the hack, media reports suggested UNH was the subject of a Department of Justice (DoJ) investigation over antitrust concerns. This is another area where we believe the risk is overblown as the DoJ has failed in the past to alter UNH’s strategy. Although UNH runs the largest private health insurer in the US, has a sizable physician network, one of the largest pharmacy benefits managers and large billing and data businesses, we believe its integrated approach is instrumental in improving health outcomes and lower costs, benefiting both consumers and payors. Lastly, rising medical cost trends fueled by higher care utilization will generally pressure health insurers’ profitability. We believe UNH has appropriately priced its policies to account for current trends and its broad product offering will help it mitigate any margin pressure in its health insurance business. One area we are paying close attention to is how competitors respond to the current backdrop. In the past, efforts to gain market share through aggressive pricing during a rising cost environment have not been good for industry valuations. We believe the industry has learned from past mistakes and recent competitor commentary suggest so, however, time will tell.
Transactions:
Two new positions were initiated during the quarter: McKesson Corp. (MCK) and Marsh & McLennan Companies Inc (MMC), both of whom are high quality businesses from whom we expect high dividend growth going forward.
MCK is one of the three largest pharmaceutical distributors in the US, servicing both drug manufacturers and health care providers. The company operates in an oligopolistic industry that has high barriers to entry. The three largest distributors now collectively control over 90% of drug sales that flow through the U.S. distribution channel. MCK has historically delivered excellent returns on capital due to good cash conversion and inventory turns along with minimal capital spending requirements. There are secular tailwinds, including an aging population, the expected growth in the use of biosimilars, their specialty segment and of GLP-1 drugs, that we believe will drive the company’s ability to grow earnings, free cash flows and subsequently dividends.
MMC is the world’s leading professional services firm in risk, strategy and people. Like MCK, MMC operates in an oligopolistic industry; large insurance brokers have considerable advantages versus smaller brokers in serving global multinationals and competition is limited by the regulatory and specialized nature of insurance. The company also has the tailwind of a “hard” insurance market driving policy prices higher (which is good for broker commissions) without the commensurate underwriting risk, a resilient business model (insurance is a “must have”, not a “nice to have”), and a long-term track record of profitable revenue growth.
To fund the acquisitions, we exited our stakes in American Tower Corp. and Starbucks Corp, both primarily due to lower expected dividend growth.
In addition, as per our quarterly rebalancing process, we trimmed our holdings in Applied Materials and Broadcom, and increased our position in UnitedHealth Group.
Canadian Equity Strategy
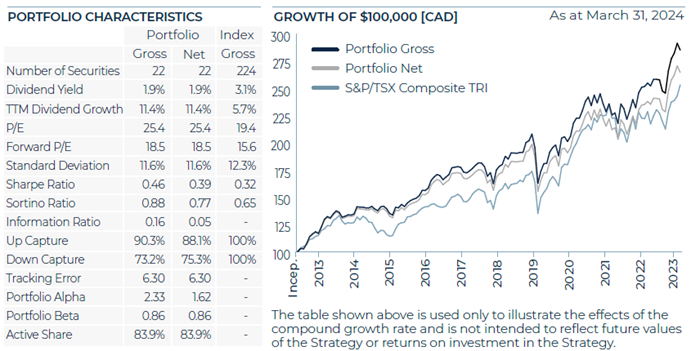
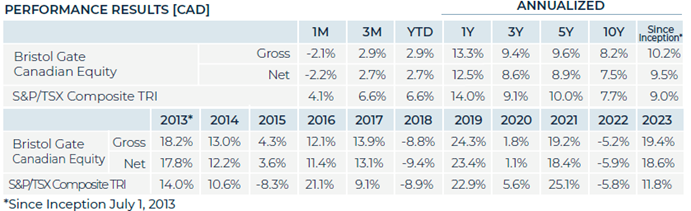
Source: Bristol Gate Capital Partners. There is a risk of loss inherent in any investment; past performance is not indicative of future results. Please see important disclosures at end of document.
Market Recap:
The S&P/TSX Composite rose 6.6% during the period, on the back of a rally in Energy stocks as well as the Health Care and Industrials sectors. The Bank of Canada continued to hold rates at current levels given continued sluggish growth in the economy. Increased price competition amongst the telecoms was reflected in valuations for was the worst performing sector during the quarter.
Portfolio Results:
The Canadian Equity strategy underperformed the benchmark in the period.
Contributors:
An underweight to Financials, combined with stock selection, an overweight to Industrials despite negative stock selection, and no exposure to Utilities contributed to returns in the period.
On an absolute basis, Waste Connections Inc, CCL Industries Inc, and Toromont Industries Ltd were amongst our best performers in the period.
Waste Connections delivered a strong quarter finishing strong a volatile fiscal year for the company, coupled with a constructive guidance for the year ahead, as inputs inflation subsides and pricing for its services remains strong. A leader in the waste collection space, it continues to execute its strategy of organic growth, operational efficiencies and tuck-in acquisitions.
Similarly, CCL’s share price responded positively after its earnings beat expectations on stronger organic growth and increased operating margins. Management provided positive guidance for the year ahead as previous investments have added capacity in growing segments of its business. It also increased its quarterly dividend by 9.4%.
Toromont reported a strong quarter to cap off a solid year for the company. While normalization continues in the equipment market, the company continues to grow through multiple avenues including equipment sales, rentals and support. Additionally, management has the balance sheet capacity to pursue M&A opportunities. In the meantime, it raised its quarterly dividend by 11.6%.
Detractors:
Stock selection in the Information Technology and Consumer Staples sectors detracted from returns in the period. Additionally, being overweight in Consumer Staples and underweight in Information Technology also contributed negatively to the performance.
On an absolute basis, Zoetis Inc (ZTS), Enghouse Systems Ltd (ENGH), and Jamieson Wellness Inc (JWEL) were amongst the weakest performers in the period.
ZTS fell due to competitive concerns on key franchises like Simparica Trio in parasiticides, and Apoquel and Cytopoint in dermatology as new entrants entered or are expected to enter the markets. We believe the company has several strategies at its disposal to not only defend share but continue growing it, including chewables in Apoquel or longer lasting versions of Cytopoint. In the parasiticide market, less effective treatments like collars retain a large share of the market which we expect to provide continued conversion opportunities for Simparica Trio. Competitive entrants should help grow the segment through increased consumer awareness. In addition to the competition issues, ZTS was pressured by investor concerns regarding the safety of a new osteoarthritis (OA) drug launched in the US called Librela. We believe the safety concerns are overblown as the drug has been in markets outside the US for almost three years now with 11 million doses globally since the launch. Management has reported no unusual trends or signals with its US experience thus far.
Enghouse posted a weaker than expected quarter, as its clients continued to transition to its cloud offerings, which is associated by additional capital expenditure and deferred sales. Financially the company is stronger than ever, with a record cash balance and no debt, ready to pursue its M&A strategy that has created significant value for its shareholders over the years. It also raised its dividend by 18.2%.
Jamieson Wellness missed expectations and management offered weaker than expected guidance, affecting negatively its stock price. The miss was primarily driven by its domestic market and closely tied to one specific customer. Internationally Jamieson continues to execute its strategy as both its segments in US and China are performing well.
Transactions:
During the quarter we exited our investment in Canadian Pacific Kansas City Ltd (CP). We continue to believe that CP remains a high-quality business, but a lack of dividend growth means we had to move on to remain disciplined with our process.
Going forward, the Canadian Equity strategy will hold 22 names to align with our US Equity strategy.
As per our quarterly rebalancing process, we added to our investments in Telus, Premium Brands Holdings, Open Text, FirstService and Intact Financial with the proceeds from the sale of CP.
Firm Update
To all our clients, thank you for your ongoing support and trust. We are determined to do everything we can to provide you income growth and strong investment returns in the future.
Sincerely,
The Bristol Gate Team
Important disclosures
There is a risk of loss inherent in any investment; past performance is not indicative of future results. Prospective and existing investors in Bristol Gate’s pooled funds or ETF funds should refer to the fund’s offering documents which outline the risk factors associated with a decision to invest. Separately managed account clients should refer to disclosure documents provided which outline risks of investing. Pursuant to SEC regulations, a description of risks associated with Bristol Gate’s strategies is also contained in Bristol Gate’s Form ADV Part 2A located at www.bristolgate.com/regulatory-documents.
US Equity Strategy returns in this report refer to the Bristol Gate US Equity Strategy Composite (the “Composite”). The Composite consists of equities of publicly traded, dividend paying US companies. The Composite is valued in US Dollars and for comparison purposes is measured against the S&P 500 Total Return Index. The composite’s Investment Advisor, Bristol Gate Capital Partners Inc., defines itself as a portfolio manager, exempt market dealer and investment fund manager (as per its registration in Ontario, its principal regulator in Canada) and is also a Registered Investment Adviser with the U.S. Securities and Exchange Commission (the “SEC”). The Investment Advisor’s objective is to select companies with positive dividend growth, and which collectively will generate over the long term a growing income and capital appreciation for investors. The inception date of the Composite is May 15, 2009. The US Dollar is the currency used to measure performance, which is presented on a gross and net basis and includes the reinvestment of investment income. The composite’s gross return is gross of withholding tax prior to January 1, 2017 and is net of withholding tax thereafter. Net returns are calculated by reducing the gross returns by the maximum management fee charged by Bristol Gate of 1%, applied monthly. Actual investment advisory fees incurred by clients may vary. There is the opportunity for the use of leverage up to 30% of the net asset value of the underlying investments using a margin account at the prime broker. Thus far no material leverage has been utilized. An investor’s actual returns may be reduced by management fees, performance fees, and other operating expenses that may be incurred because of the management of the composite. A performance fee may also be charged on some accounts and funds managed by the firm. Bristol Gate claims compliance with the Global Investment Performance Standards (GIPS®). GIPS® is a registered trademark of CFA Institute. CFA Institute does not endorse or promote this organization, nor does it warrant the accuracy or quality of the content contained herein. To obtain a GIPS Composite Report, please email us at info@bristolgate.com.
The S&P 500® Total Return Index measures the performance of the broad US equity market, including dividend re-investment, in US dollars. This index is provided for information only and comparisons to the index has limitations. The benchmark is an appropriate standard against which the performance of the strategy can be measured over longer time periods as it represents the primary investment universe from which Bristol Gate selects securities. However, Bristol Gate’s portfolio construction process differs materially from that of the benchmark and the securities selected for inclusion in the strategy are not influenced by the composition of the benchmark. For example, the strategy is a concentrated portfolio of approximately equally weighted dividend-paying equity securities, rebalanced quarterly whereas the benchmark is a broad stock index (including both dividend and non-dividend paying equities) that is market capitalization weighted. As such, strategy performance deviations relative to the benchmark may be significant, particularly over shorter time periods. The strategy has concentrated investments in a limited number of companies; as a result, a change in one security’s value may have a more significant effect on the strategy’s value.
S&P 500 ® Total Return Dividend Aristocrats Index measures the performance of a subset of S&P 500® Index companies that have increased their dividends every year for the last 25 consecutive years. This Index has limited relevancy to our approach as it focuses on historical dividend growth, whereas Bristol Gate’s US Equity strategy’s securities are selected based on future dividend growth.
S&P 500 ® High Dividend Index is designed to measure the performance of 80 high yield companies within the S&P 500 and is equally weighted to best represent the performance of this group, regardless of constituent size. This Index has
limited relevancy to our approach as it focuses on dividend yield, whereas Bristol Gate’s US Equity strategy’s securities are selected based on future dividend growth.
SPDR® S&P 500® ETF Trust (SPY US) sourced from Bloomberg has been used as a proxy for the S&P 500® Total Return Index for the purpose of providing non-return-based portfolio statistics and sector weightings in this report. SPY US is an ETF that seeks to provide investment results that, before expenses, correspond generally to the price and yield performance of the S&P 500® Index.
Canadian Equity Strategy returns in this report refer to the Bristol Gate Canadian Equity Strategy Composite (the “Composite”). The Composite consists primarily of equities of publicly traded, dividend paying Canadian companies.
The Composite is valued in Canadian Dollars and for comparison purposes is measured against the S&P/TSX. The composite’s Investment Advisor, Bristol Gate Capital Partners Inc., defines itself as a portfolio manager, exempt market dealer and investment fund manager (as per its registration in Ontario, its principal regulator in Canada) and is also a Registered Investment Adviser with the U.S. Securities and Exchange Commission (the “SEC”). The Investment Advisor’s objective is to select companies primarily from the S&P/TSX universe with positive dividend growth and which collectively will generate over the long term a growing income and capital appreciation for investors. The inception date of the Composite is July 1, 2013. Returns are presented gross and net of fees and include the reinvestment of all income. The composite’s gross return is gross of withholding tax prior to January 1, 2017 and is net of withholding tax thereafter. Net returns are calculated by reducing the gross returns by the maximum management fee charged by Bristol Gate of 0.7%, applied monthly. Actual investment advisory fees incurred by clients may vary. An investor’s actual returns may be reduced by management fees, performance fees, and other operating expenses that may be incurred because of the management of the composite. A performance fee may be charged on some accounts and funds managed by the firm. Bristol Gate claims compliance with the Global Investment Performance Standards (GIPS®). GIPS® is a registered trademark of CFA Institute. CFA Institute does not endorse or promote this organization, nor does it warrant the accuracy or quality of the content contained herein. To obtain a GIPS Composite Report, please email us at info@bristolgate.com.
The returns have been converted into Canadian Dollars using month‐end Bank of Canada Closing rates.
The S&P/TSX Total Return Index measures the performance of the broad Canadian equity market, including dividend re-investment, in Canadian dollars. This index has been provided for information only and comparisons to the index has limitations. The benchmark is an appropriate standard against which the performance of the strategy can be measured over longer time periods as it represents the primary investment universe from which Bristol Gate selects securities. However, Bristol Gate’s portfolio construction process differs materially from that of the benchmark and the securities selected for inclusion in the strategy are not influenced by the composition of the benchmark. For example, the strategy is a concentrated portfolio of approximately equally weighted dividend-paying equity securities, rebalanced quarterly whereas the benchmark is a broad stock index (including both dividend and non-dividend paying equities) that is market capitalization weighted. As such, strategy performance deviations relative to the benchmark may be significant, particularly over shorter time periods. The strategy has concentrated investments in a limited number of companies; as a result, a change in one security’s value may have a more significant effect on the strategy’s value.
iShares Core S&P®/TSX® Capped Composite Index ETF (XIC CN) sourced from Bloomberg has been used as a proxy for the S&P®/TSX® Total Return Index for the purpose of providing non-return-based portfolio statistics and sector weightings in this report. XIC CN is an ETF that seeks long-term capital growth by replicating the performance of the S&P®/TSX® Capped Composite Index, net of expenses.
This Report is for information purposes and should not be construed under any circumstances as a public offering of securities in any jurisdiction in which an offer or solicitation is not authorized. Prospective investors in Bristol Gate’s pooled funds or ETF funds should rely solely on the fund’s offering documents, which outline the risk factors associated
with a decision to invest. No representations or warranties of any kind are intended or should be inferred with respect to the economic return or the tax implications of any investment in a Bristol Gate fund.
This piece is presented for illustrative and discussion purposes only. It should not be considered as personal investment advice or an offer or solicitation to buy and/or sell securities and it does not consider unique objectives, constraints, or financial needs of the individual. Under no circumstances does this piece suggest that you should time the market in any way or make investment decisions based on the content. Investors are advised that their investments are not guaranteed, their values change frequently, and past performance may not be repeated. References to specific securities are presented to illustrate the application of our investment philosophy only, do not represent all of the securities purchased, sold or recommended for the portfolio, and it should not be assumed that investments in the securities identified were or will be profitable and should not be considered recommendations by Bristol Gate Capital Partners Inc. A full list of security holdings is available upon request. For more information contact Bristol Gate Capital Partners Inc. directly. The information contained in this piece is the opinion of Bristol Gate Capital Partners Inc. and/or its employees as of the date of the piece and is subject to change without notice. Every effort has been made to ensure accuracy in this piece at the time of publication; however, accuracy cannot be guaranteed. Market conditions may change and Bristol Gate Capital Partners Inc. accepts no responsibility for individual investment decisions arising from the use of or reliance on the information contained herein. We strongly recommend you consult with a financial advisor prior to making any investment decisions. Please refer to the Legal section of Bristol Gate’s website for additional information at bristolgate.com.
A Note About Forward-Looking Statements
This report may contain forward-looking statements including, but not limited to, statements about the Bristol Gate strategies, risks, expected performance and condition. Forward-looking statements include statements that are predictive in nature, that depend upon or refer to future events and conditions or include words such as “may”, “could”, “would”, “should”, “expect”, “anticipate”, “intend”, “plan”, “believe”, “estimate” and similar forward-looking expressions or negative versions thereof.
These forward-looking statements are subject to various risks, uncertainties and assumptions about the investment strategies, capital markets and economic factors, which could cause actual financial performance and expectations to differ materially from the anticipated performance or other expectations expressed. Economic factors include, but are not limited to, general economic, political and market factors in North America and internationally, interest and foreign exchange rates, global equity and capital markets, business competition, technological change, changes in government regulations, unexpected judicial or regulatory proceedings, and catastrophic events.
Readers are cautioned not to place undue reliance on forward-looking statements and consider the above-mentioned factors and other factors carefully before making any investment decisions. All opinions contained in forward-looking statements are subject to change without notice and are provided in good faith. Forward-looking statements are not guarantees of future performance, and actual results could differ materially from those expressed or implied in any forward-looking statements. Bristol Gate Capital Partners Inc. has no specific intention of updating any forward-looking statements whether as a result of new information, future events or otherwise, except as required by securities legislation.
 Takes 2 minutes