
Performance Summary
From a return perspective, US Equity Strategy portfolio underperformed the S&P 500 Total Return Index during the quarter. Our Canadian Equity Strategy outperformed the S&P/TSX Composite Total Return Index in the quarter. Both the US and Canadian Equity Strategies continued to outpace their respective benchmarks in terms of dividend growth. For a more detailed discussion on performance see each Strategy’s respective section below.
Portfolio Dividend Growth – Trailing and consensus forward 12 months.

Note: Last 12 months (“LTM”) Dividend Growth is the median of the actual trailing 12-month dividend growth of the individual stocks held by Strategies or Index constituents as reported by Bloomberg as at June 30, 2023. Forward 12 months (“FTM”) Dividend Growth is the median of the Bristol Gate Model’s forward 12-month prediction for the individual stocks held by the Strategies and the median of consensus estimates for the constituents of the Indices as of quarter end. Companies without a consensus dividend forecast were excluded. Return commentary based on gross returns.
Source: Bloomberg, FactSet, Bristol Gate Capital Partners.
Commentary
The macro environment remains perplexing. Will aggressive Fed policy lead to higher for longer rates, a tightening credit backdrop, weakening consumer spending and declining earnings, or are we set for a soft landing, with falling inflation, a resilient housing market, rising real wages and troughing earnings growth? The truth is we don’t know. In our last quarterly note, we discussed the importance of building a diversified portfolio, recognizing the myriad of possible outcomes we face. However, on its own, a diversified portfolio is not always enough to stay invested during uncertain times. To remain invested through turbulent times you need to have confidence in a sound investment thesis based on proven, timeless investment concepts like those we have developed at Bristol Gate.
Our conviction remains that the income stream an asset produces and its value are inherently linked over time. So, we attempt to discover great businesses that will grow their dividends at well above market rates for long periods of time before others do. We do this by combining art and science. Our process of combining artificial intelligence in the form of a machine learning prediction model with deep-rooted fundamental analysis ensures that we own high-quality companies that are growing their dividends at high rates. The result should lead to a growing income stream for our investors and the capital appreciation that typically comes along with that.
Long time clients know that we often liken our investment approach to real estate investing, comparing our portfolio of 22 holdings to a building with a fixed number of rental units. Just as the value of a building rises along with the growth in its rents, so can a company’s value with the growth in its dividends.
Positioning yourself in the right area of the market can do wonders for your wealth. Real estate investing is often about location, location, location, and we think the same applies to equity investing. By operating in North America, we benefit from having our companies protected by of the rule of law and by participating in well developed, deep liquid markets. Within those markets, there are plenty of high-quality companies, which provide many potential candidates for our portfolio.
We have been successful at finding companies that grow their dividends by a lot each year. It’s like housing tenants that can afford annual rental increases in the mid-teens or better. We know these companies have proven to provide attractive long-term returns when compared to other parts of the market, offering the safety of a dividend yield, along with the opportunities that come with growth. Our metaphorical building also has the benefit of no rental controls, so whenever it appears that one of our tenants cannot meet our annual rent hike, we can easily fill that unit with another company that meets our high standards.
One of the benefits of our real estate analogy is that it keeps us, and our investors focused on what we believe drives long term value creation: the growing income stream and the underlying free cash flow that drives it, not the daily price movements that can swing wildly.
If we can consistently find tenants like the ones described above and focus on the things we believe drive long term value, we think we will be able to provide attractive returns that are very competitive with the benchmarks we evaluate ourselves against over time. However, that doesn’t mean we will beat the benchmark every year.
This year is a perfect example of that. A small group of tech and tech related companies have dominated US market returns as investors have been captivated with the possibilities of Artificial Intelligence (“AI”). Unfortunately for us, many of these companies do not pay a dividend, or if they do, they do not grow it fast enough to meet our objectives and are therefore not in our investable universe. In fact, the last three years has seen a macro-driven market, impacted by COVID, tighter monetary policy and predictions of pending recession. Combined, these factors have made it difficult to achieve the price performance we would have liked.
But, over the last three years, our companies have performed very well from a fundamental perspective, especially when compared to the average company in the market.
Exhibit 1: Bristol Gate US Equity Strategy Median 3 Year Operating Metrics vs S&P 500
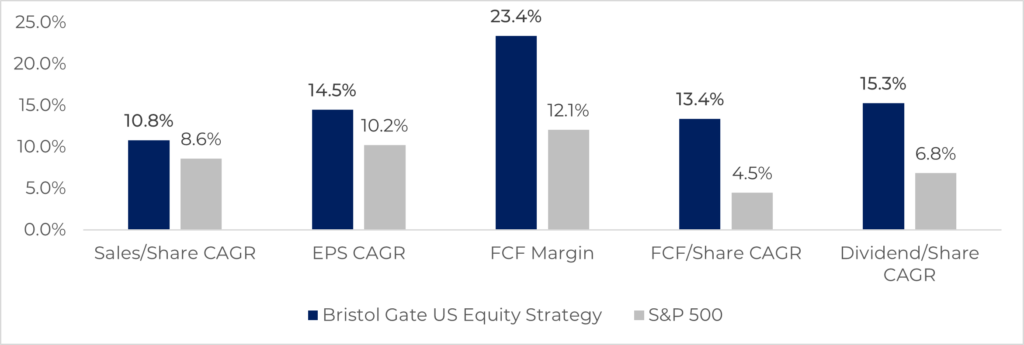
Source: Bristol Gate Capital Partners, Bloomberg. As at June 30, 2023
Our portfolio companies have delivered earnings growth and free cash flow margins significantly greater than that of the average company in the S&P 500. In terms of free cash flow per share, the average company in the S&P 500 has delivered less than half the free cash flow growth relative to the businesses we own. And we are delivering more dividend growth than the rest of the dividend paying stocks in the market. Eventually, we firmly believe these fundamentals will be rewarded.
While it is understandable that many investors focus on price returns, our focus will always be on what we own, because ultimately it is their fundamentals that drive price over time. From that perspective, we are confident that our investors will be rewarded for their patience.
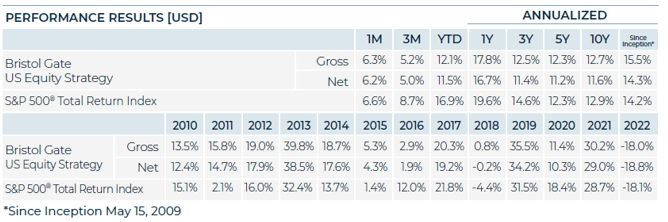
US Equity Strategy (all returns USD)
After a strong first quarter, expectations were muted going into Q2 as concerns over a possible recession remained. However, the S&P 500 once again surprised rising over 8%, despite the average S&P 500 company reporting a decline in earnings during the first quarter of 2023 and consensus expectations for further declines in Q2.
Exhibit 2: Impact of select stocks on Q2 2023 total market return.
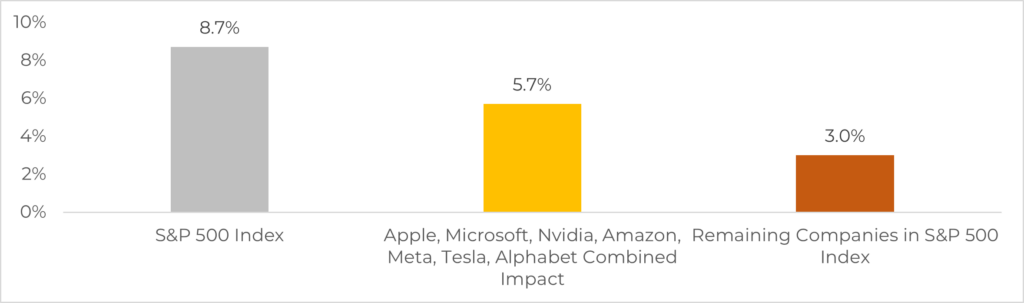
Source: Bloomberg, Bristol Gate Capital Partners. As at June 30, 2023.
The market pushed higher on the back of AI-related euphoria, as a group of stocks being dubbed the “Magnificent Seven” were once again responsible for the bulk of the rally. Apple, Microsoft, Nvidia, Tesla, Amazon, Meta and Alphabet accounted for two-thirds of the index’s return for the quarter, and other than Microsoft, which we own, none of the others pay a dividend or meet our criteria for high dividend growth. Market breadth remains narrow.
Dividend paying stocks underperformed non-dividend paying stocks on average by 5.2 percentage points in the second quarter and by 17.50 percentage points year-to-date. The difference is even wider on a market capitalization basis.
The US Equity strategy continued to outperform the dividend paying component of the Index but underperformed the S&P 500 during the quarter. Stock selection in the Consumer Discretionary sector, as well as both allocation and selection effects in Communication Services and Financials were the primary drivers of underperformance. This was partially offset by having no exposure to either Energy or Utilities, as well as stock selection in the Industrials sector.
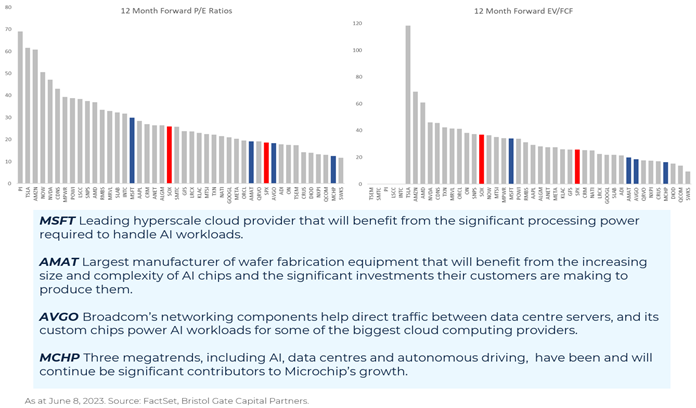
On an absolute basis, Broadcom, Microsoft and Applied Materials were among the largest contributors during the quarter benefiting from the AI excitement. We believe we are participating responsibly as the companies we own trade at attractive absolute and relative valuations considering the opportunities they have ahead of them.
Exhibit 3. Responsibly Participating in the AI Tech Revolution
Broadcom also announced during the quarter that the company had entered into two separate multi-year agreements with Apple AAPL for the supply of a range of specified high-performance RF and wireless components and modules.
Dollar General, MSCI and Thermo Fisher Scientific were the among the largest detractors during the quarter. Dollar General’s earnings disappointed as the company is facing a challenging environment. MSCI’s stock suffered on a slowdown in their ESG-related segment. Management reported seeing fewer larger deals, longer sales cycles and higher cancellations all due to the negative view some states have taken on ESG and changing regulation in Europe. Despite these challenges, the segment still delivered ~30% growth, and we believe the market is overreacting in the short-term. The fundamentals of the business are strong, and the management team has consistently allocated capital effectively. Thermo Fisher’s first-quarter earnings matched expectations, although results were somewhat marred by what we view as an expected decline in Covid-19-related testing revenue.
Although the portfolio’s price return lagged the market in the quarter, it continues to deliver from a fundamental perspective. Year-to-date, 11 of our companies have announced dividend increases averaging over 15% growth. This is well ahead of the market’s dividend growth and is supported by better revenue and earnings growth. In sharp contrast to the market, our portfolio companies delivered 13.9% earnings growth compared to the Index’s 3.7% decline for the first quarter of 2023. We expect the favorable fundamental trends to continue into the Q2 reporting season and believe the market will eventually recognize the strong relative performance.
Exhibit 4: Q1/23 Earnings and Revenue Growth
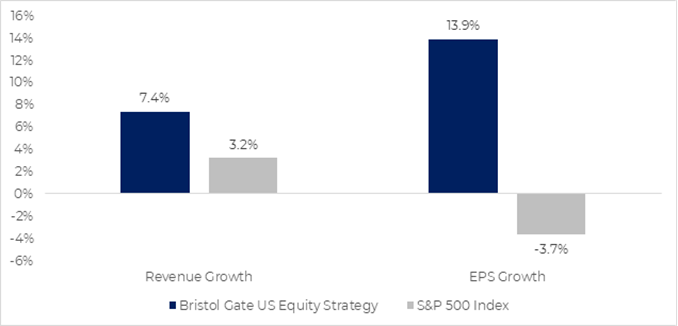
Source: Zacks, Bristol Gate Capital Partners.
Exhibit 5: US Equity Strategy Risk and Return Metrics
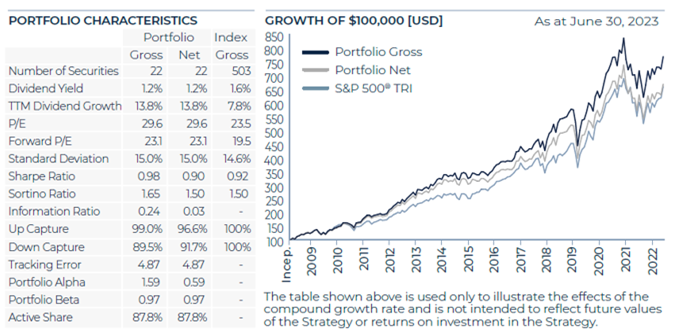
Source: Bristol Gate Capital Partners. There is a risk of loss inherent in any investment; past performance is not indicative of future results. Please see important dislosures at end of document.
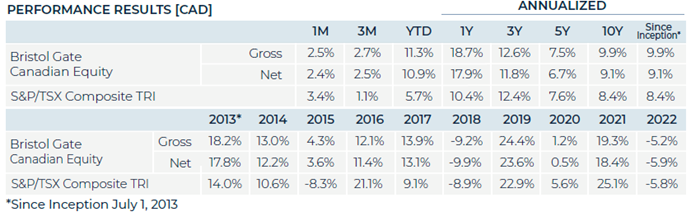
Canadian Equity Strategy (all returns CAD)
The Canadian economy continues to remain in flux, as a strong labour market continues to face stubborn levels of inflation, leading to the Bank of Canada once again raising interest rates in June after not hiking since January, and signalling another potential hike. Against that backdrop, the S&P/TSX Composite Index rose just over 1% during the quarter.
The Canadian Equity strategy continues to perform well in this environment and outperformed the index during the period. Stock selection drove most of the outperformance, particularly in the Materials and Financials sectors. This was partially offset by stock selection in the Information Technology, which essentially is because the strategy did not own Shopify, a stock that does not pay a dividend and as such is not in our investable universe.
From an absolute perspective, Stella-Jones, Element Fleet Management and Dollarama were among the top contributors to the strategy’s performance in the quarter. Enghouse, Jamieson and Colliers International were among the largest detractors.
From a fundamental perspective, the portfolio’s performance continues to reflect the quality of the businesses we do hold. With 20 companies reporting first quarter results through the end of June, the revenue and earnings growth for the portfolio has averaged 13% and 8.8%, respectively. Additionally, 11 companies have announced dividend increases this year, averaging over 11%, which stands in stark contrast to the index which saw the average company in the S&P/TSX Composite deliver a ~16% earnings decline in the first quarter.
We remain focused on finding high quality businesses that deliver high dividend growth at a reasonable price to continue to deliver strong investment returns to our clients.
Exhibit 3. Canadian Equity Strategy Risk and Return Metrics
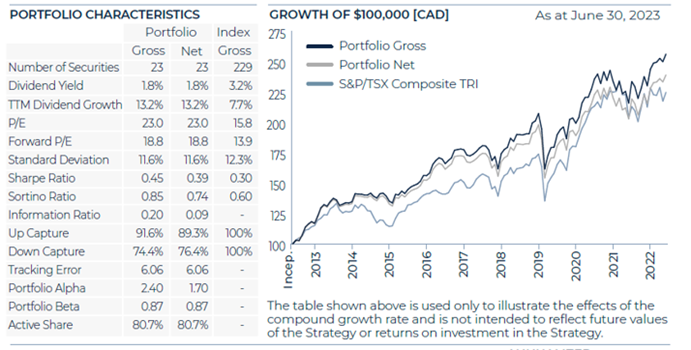
Source: Bristol Gate Capital Partners. There is a risk of loss inherent in any investment; past performance is not indicative of future results. Please see important disclosures at end of document.
Firm Update
To all our clients, thank you for your ongoing support and trust. We are determined to do everything we can to provide you continued income growth and strong investment returns going forward.
Sincerely,
The Bristol Gate Team
Important disclosures
There is a risk of loss inherent in any investment; past performance is not indicative of future results. Prospective and existing investors in Bristol Gate’s pooled funds or ETF funds should refer to the fund’s offering documents which outline the risk factors associated with a decision to invest. Separately managed account clients should refer to disclosure documents provided which outline risks of investing. Pursuant to SEC regulations, a description of risks associated with Bristol Gate’s strategies is also contained in Bristol Gate’s Form ADV Part 2A located at www.bristolgate.com/regulatory-documents.
US Equity Strategy returns in this report refer to the Bristol Gate US Equity Strategy Composite (the “Composite”). The Composite consists of equities of publicly traded, dividend paying US companies. The Composite is valued in US Dollars and for comparison purposes is measured against the S&P 500 Total Return Index. The composite’s Investment Advisor, Bristol Gate Capital Partners Inc., defines itself as a portfolio manager, exempt market dealer and investment fund manager (as per its registration in Ontario, its principal regulator in Canada) and is also a Registered Investment Adviser with the U.S. Securities and Exchange Commission (the “SEC”). The Investment Advisor’s objective is to select companies with positive dividend growth, and which collectively will generate over the long term a growing income and capital appreciation for investors. The inception date of the Composite is May 15, 2009. The US Dollar is the currency used to measure performance, which is presented on a gross and net basis and includes the reinvestment of investment income. The composite’s gross return is gross of withholding tax prior to January 1, 2017 and is net of withholding tax thereafter. Net returns are calculated by reducing the gross returns by the maximum management fee charged by Bristol Gate of 1%, applied monthly. Actual investment advisory fees incurred by clients may vary. There is the opportunity for the use of leverage up to 30% of the net asset value of the underlying investments using a margin account at the prime broker. Thus far no material leverage has been utilized. An investor’s actual returns may be reduced by management fees, performance fees, and other operating expenses that may be incurred because of the management of the composite. A performance fee may also be charged on some accounts and funds managed by the firm. Bristol Gate claims compliance with the Global Investment Performance Standards (GIPS®). GIPS® is a registered trademark of CFA Institute. CFA Institute does not endorse or promote this organization, nor does it warrant the accuracy or quality of the content contained herein. To obtain a GIPS Composite Report, please email us at info@bristolgate.com.
The S&P 500® Total Return Index measures the performance of the broad US equity market, including dividend re-investment, in US dollars. This index is provided for information only and comparisons to the index has limitations. The benchmark is an appropriate standard against which the performance of the strategy can be measured over longer time periods as it represents the primary investment universe from which Bristol Gate selects securities. However, Bristol Gate’s portfolio construction process differs materially from that of the benchmark and the securities selected for inclusion in the strategy are not influenced by the composition of the benchmark. For example, the strategy is a concentrated portfolio of approximately equally weighted dividend-paying equity securities, rebalanced quarterly whereas the benchmark is a broad stock index (including both dividend and non-dividend paying equities) that is market capitalization weighted. As such, strategy performance deviations relative to the benchmark may be significant, particularly over shorter time periods. The strategy has concentrated investments in a limited number of companies; as a result, a change in one security’s value may have a more significant effect on the strategy’s value.
SPDR® S&P 500® ETF Trust (SPY US) sourced from Bloomberg has been used as a proxy for the S&P 500® Total Return Index for the purpose of providing non-return based portfolio statistics and sector weightings in this report. SPY US is an ETF that seeks to provide investment results that, before expenses, correspond generally to the price and yield performance of the S&P 500® Index.
Canadian Equity Strategy returns in this report refer to the Bristol Gate Canadian Equity Strategy Composite (the “Composite”). The Composite consists primarily of equities of publicly traded, dividend paying Canadian companies. The Composite is valued in Canadian Dollars and for comparison purposes is measured against the S&P/TSX. The composite’s Investment Advisor, Bristol Gate Capital Partners Inc., defines itself as a portfolio manager, exempt market dealer and investment fund manager (as per its registration in Ontario, its principal regulator in Canada) and is also a Registered Investment Adviser with the U.S. Securities and Exchange Commission (the “SEC”). The Investment Advisor’s objective is to select companies primarily from the S&P/TSX universe with positive dividend growth and which collectively will generate over the long term a growing income and capital appreciation for investors. The inception date of the Composite is July 1, 2013. Returns are presented gross and net of fees and include the reinvestment of all income. The composite’s gross return is gross of withholding tax prior to January 1, 2017 and is net of withholding tax thereafter. Net returns are calculated by reducing the gross returns by the maximum management fee charged by Bristol Gate of 0.7%, applied monthly. Actual investment advisory fees incurred by clients may vary. An investor’s actual returns may be reduced by management fees, performance fees, and other operating expenses that may be incurred because of the management of the composite. A performance fee may be charged on some accounts and funds managed by the firm. Bristol Gate claims compliance with the Global Investment Performance Standards (GIPS®). GIPS® is a registered trademark of CFA Institute. CFA Institute does not endorse or promote this organization, nor does it warrant the accuracy or quality of the content contained herein. To obtain a GIPS Composite Report, please email us at info@bristolgate.com.
The returns have been converted into Canadian Dollars using month‐end Bank of Canada Closing rates.
The S&P/TSX Total Return Index measures the performance of the broad Canadian equity market, including dividend re-investment, in Canadian dollars. This index has been provided for information only and comparisons to the index has limitations. The benchmark is an appropriate standard against which the performance of the strategy can be measured over longer time periods as it represents the primary investment universe from which Bristol Gate selects securities. However, Bristol Gate’s portfolio construction process differs materially from that of the benchmark and the securities selected for inclusion in the strategy are not influenced by the composition of the benchmark. For example, the strategy is a concentrated portfolio of approximately equally weighted dividend-paying equity securities, rebalanced quarterly whereas the benchmark is a broad stock index (including both dividend and non-dividend paying equities) that is market capitalization weighted. As such, strategy performance deviations relative to the benchmark may be significant, particularly over shorter time periods. The strategy has concentrated investments in a limited number of companies; as a result, a change in one security’s value may have a more significant effect on the strategy’s value.
This Report is for information purposes and should not be construed under any circumstances as a public offering of securities in any jurisdiction in which an offer or solicitation is not authorized. Prospective investors in Bristol Gate’s pooled funds or ETF funds should rely solely on the fund’s offering documents, which outline the risk factors associated with a decision to invest. No representations or warranties of any kind are intended or should be inferred with respect to the economic return or the tax implications of any investment in a Bristol Gate fund.
This piece is presented for illustrative and discussion purposes only. It should not be considered as personal investment advice or an offer or solicitation to buy and/or sell securities and it does not consider unique objectives, constraints, or financial needs of the individual. Under no circumstances does this piece suggest that you should time the market in any way or make investment decisions based on the content. Investors are advised that their investments are not guaranteed, their values change frequently, and past performance may not be repeated. References to specific securities are presented to illustrate the application of our investment philosophy only, do not represent all of the securities purchased, sold or recommended for the portfolio, and it should not be assumed that investments in the securities identified were or will be profitable and should not be considered recommendations by Bristol Gate Capital Partners Inc. A full list of security holdings is available upon request. For more information contact Bristol Gate Capital Partners Inc. directly. The information contained in this piece is the opinion of Bristol Gate Capital Partners Inc. and/or its employees as of the date of the piece and is subject to change without notice. Every effort has been made to ensure accuracy in this piece at the time of publication; however, accuracy cannot be guaranteed. Market conditions may change and Bristol Gate Capital Partners Inc. accepts no responsibility for individual investment decisions arising from the use of or reliance on the information contained herein. We strongly recommend you consult with a financial advisor prior to making any investment decisions. Please refer to the Legal section of Bristol Gate’s website for additional information at bristolgate.com.
A Note About Forward-Looking Statements
This report may contain forward-looking statements including, but not limited to, statements about the Bristol Gate strategies, risks, expected performance and condition. Forward-looking statements include statements that are predictive in nature, that depend upon or refer to future events and conditions or include words such as “may”, “could”, “would”, “should”, “expect”, “anticipate”, “intend”, “plan”, “believe”, “estimate” and similar forward-looking expressions or negative versions thereof.
These forward-looking statements are subject to various risks, uncertainties and assumptions about the investment strategies, capital markets and economic factors, which could cause actual financial performance and expectations to differ materially from the anticipated performance or other expectations expressed. Economic factors include, but are not limited to, general economic, political and market factors in North America and internationally, interest and foreign exchange rates, global equity and capital markets, business competition, technological change, changes in government regulations, unexpected judicial or regulatory proceedings, and catastrophic events.
Readers are cautioned not to place undue reliance on forward-looking statements and consider the above-mentioned factors and other factors carefully before making any investment decisions. All opinions contained in forward-looking statements are subject to change without notice and are provided in good faith. Forward-looking statements are not guarantees of future performance, and actual results could differ materially from those expressed or implied in any forward-looking statements. Bristol Gate Capital Partners Inc. has no specific intention of updating any forward-looking statements whether as a result of new information, future events or otherwise, except as required by securities legislation.
 Takes 2 minutes