
Author: Cole Heideman
Bristol Gate Capital Partners CIO, Izet Elmazi, discusses the current market environment and its impact on our portfolios.
Important Disclosures
There is a risk of loss inherent in any investment; past performance is not indicative of future results. Prospective and existing investors in Bristol Gate’s pooled funds or ETF funds should refer to the fund’s offering documents which outline the risk factors associated with a decision to invest. Separately managed account clients should refer to disclosure documents provided which outline risks of investing. Pursuant to SEC regulations, a description of risks associated with Bristol Gate’s strategies is also contained in Bristol Gate’s Form ADV Part 2A located at www.bristolgate.com/regulatory-documents.
This piece is presented for illustrative and discussion purposes only. It should not be considered as personal investment advice or an offer or solicitation to buy and/or sell securities and it does not consider unique objectives, constraints, or financial needs of the individual. Under no circumstances does this piece suggest that you should time the market in any way or make investment decisions based on the content. Investors are advised that their investments are not guaranteed, their values change frequently, and past performance may not be repeated. References to specific securities are presented to illustrate the application of our investment philosophy only, do not represent all of the securities purchased, sold or recommended for the portfolio, it should not be assumed that investments in the securities identified were or will be profitable and should not be considered recommendations by Bristol Gate Capital Partners Inc. A full list of security holdings is available upon request. For more information contact Bristol Gate Capital Partners Inc. directly. The information contained in this piece is the opinion of Bristol Gate Capital Partners Inc. and/or its employees as of the date of the piece and is subject to change without notice. Every effort has been made to ensure accuracy in this piece at the time of publication; however, accuracy cannot be guaranteed. Market conditions may change and Bristol Gate Capital Partners Inc. accepts no responsibility for individual investment decisions arising from the use of or reliance on the information contained herein. We strongly recommend you consult with a financial advisor prior to making any investment decisions. Please refer to the Legal section of Bristol Gate’s website for additional information at bristolgate.com.
A Note About Forward-Looking Statements
This report may contain forward-looking statements including, but not limited to, statements about the Bristol Gate strategies, risks, expected performance and condition. Forward-looking statements include statements that are predictive in nature, that depend upon or refer to future events and conditions or include words such as “may”, “could”, “would”, “should”, “expect”, “anticipate”, “intend”, “plan”, “believe”, “estimate” and similar forward-looking expressions or negative versions thereof.
These forward-looking statements are subject to various risks, uncertainties and assumptions about the investment strategies, capital markets and economic factors, which could cause actual financial performance and expectations to differ materially from the anticipated performance or other expectations expressed. Economic factors include, but are not limited to, general economic, political and market factors in North America and internationally, interest and foreign exchange rates, global equity and capital markets, business competition, technological change, changes in government regulations, unexpected judicial or regulatory proceedings, and catastrophic events. Readers are cautioned not to place undue reliance on forward-looking statements and consider the above-mentioned factors and other factors carefully before making any investment decisions. All opinions contained in forward-looking statements are subject to change without notice and are provided in good faith. Forward-looking statements are not guarantees of future performance, and actual results could differ materially from those expressed or implied in any forward-looking statements. Bristol Gate Capital Partners Inc. has no specific intention of updating any forward-looking statements whether as a result of new information, future events or otherwise, except as required by securities legislation.
TORONTO, Feb. 25, 2025 /CNW/ – Bristol Gate Capital Partners Inc. (“Bristol Gate Capital Partners”) today announced a change to the risk rating for the USD Units of Bristol Gate Concentrated US Equity ETF (the “Bristol Gate ETF”). This change will be reflected in the applicable ETF Facts and the simplified prospectus for the Bristol Gate ETF as part of the renewal of the simplified prospectus, which final simplified prospectus is expected to be filed on or around February 28, 2025.
The risk rating change set out in the table below is based on the standardized risk classification methodology mandated by the Canadian Securities Administrators and an annual review conducted by Bristol Gate Capital Partners to determine the risk level of the Bristol Gate ETF.
Effective immediately, the risk rating for the Bristol Gate ETF has changed as set out below:

Commissions, management fees and expenses all may be associated with investments in exchange-traded funds (ETFs). Before investing, investors should carefully read the prospectus and ETF facts and carefully consider the investment objectives, risks, charges and expenses of the Bristol Gate ETF. ETFs are not guaranteed; their values change frequently, and past performance may not be repeated.
For a summary of the risks of an investment in the Bristol Gate ETF, please see the specific risks set out in the simplified prospectus. All investments involve risk. The value of an ETF can go down as well as up and you could lose money. The risk rating is based on how much the ETF’s returns have changed from year to year, based on the volatility of the ETF using the standardized risk classification methodology mandated by the Canadian Securities Administrators. Historical volatility doesn’t tell you how volatile the ETF will be in the future. The rating can change over time. An ETF with a “low” risk rating can still lose money.
About Bristol Gate Capital Partners Inc.
Bristol Gate Capital Partners is an independent, employee-owned, Toronto-based investment management company serving individual and institutional clients. The firm uses predictive machine learning in combination with fundamental analysis to identify high quality companies that have the capacity and willingness to significantly increase their dividends in the year ahead. Bristol Gate Capital Partners currently manages $3.5 billion in AUM/AUA across a US equity strategy and a Canadian equity strategy and manages an ETF following each strategy. To learn more information, please visit www.bristolgate.com.
For this and more complete information about the Bristol Gate ETF call 416-921-7076 or visit www.bristolgate.com for the prospectus and ETF facts. Copies of the prospectus and ETF facts are also available on www.sedarplus.ca.
For more information, please contact: Michael Capombassis, President, 416-921-7076 x 248, mike.capombassis@bristolgate.com
Bristol Gate Capital Partners Inc. Announces Final Annual Reinvested Distributions for Bristol Gate ETFs
TORONTO, Jan. 27, 2025 /CNW/ – Bristol Gate Capital Partners Inc. (“Bristol Gate Capital Partners” or the “firm”) today announced the final annual 2024 reinvested distributions for the Bristol Gate Exchange-Traded Funds (the “Bristol Gate ETFs”).
Unitholders of record on December 31, 2024 received notional distributions representing net investment income and/or realized capital gains within the Bristol Gate ETFs for the 2024 taxation year. A notional distribution is when the units from a reinvested distribution are immediately consolidated with the units held prior to the distribution and the number of units held after the distribution is identical to the number of units held before the distribution.
The taxable amounts of reinvested distributions for 2024, including tax characteristics of the distributions, will be reported to brokers through Clearing and Depository Services (CDS) within the first 60 days of 2025. All values are expressed in Canadian dollars, unless otherwise indicated. This information is not intended to provide legal, accounting, tax, investment, financial or other advice and should not be relied upon for providing such advice.
Details of the per-unit reinvested distributions for the Bristol Gate ETFs are as follows:
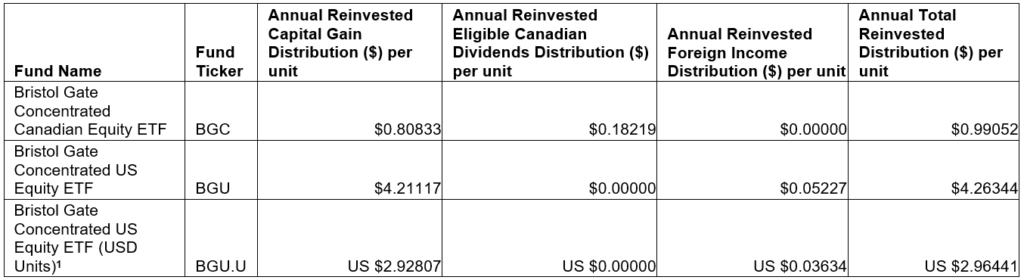
1Distribution per unit amount is reported in USD for BGU.U converted as at December 31, 2024
Commissions, management fees and expenses all may be associated with investments in exchange-traded funds (ETFs). Before investing, investors should carefully read the prospectus and ETF facts and carefully consider the investment objectives, risks, charges and expenses of the ETFs. ETFs are not guaranteed; their values change frequently, and past performance may not be repeated. For this and more complete information about the Bristol Gate ETFs call 416-921-7076 or visit www.bristolgate.com for the prospectus and ETF facts. Copies of the prospectus and ETF facts are also available on www.sedarplus.ca
About Bristol Gate Capital Partners Inc.
Bristol Gate Capital Partners is an independent, employee-owned, Toronto-based investment management company serving individual and institutional clients. The firm uses predictive machine learning in combination with fundamental analysis to identify high quality companies that have the capacity and willingness to significantly increase their dividends in the year ahead. Bristol Gate Capital Partners currently manages $3.4 billion in AUM/AUA across a US equity strategy and a Canadian equity strategy and manages an ETF following each strategy. To learn more information, please visit www.bristolgate.com.
For more information, please contact: Michael Capombassis, President, 416-921-7076 x 248, mike.capombassis@bristolgate.com
FOR IMMEDIATE RELEASE
Bristol Gate Capital Partners Inc. Announces Estimated Annual Reinvested Distributions for Bristol Gate ETFs
TORONTO, December 3, 2024 /CNW/ – Bristol Gate Capital Partners Inc. (“Bristol Gate Capital Partners” or the “firm”) today announced the estimated 2024 reinvested distributions for the Bristol Gate Exchange-Traded Funds (the “Bristol Gate ETFs”). These annual reinvested distributions generally represent realized capital gains and/or excess net income within the Bristol Gate ETFs.
The distributions will not be paid in cash but will be reinvested and reported as a taxable distribution. The reinvested distributions will increase the unitholder’s adjusted cost base for the respective ETF. The ex-dividend date for the 2024 annual distributions will be December 31, 2024. Unitholders of record on December 31, 2024 will receive the actual 2024 reinvested distributions which may vary from the estimated amounts disclosed below.
Note that these figures are estimates only, as of November 29, 2024, are not guaranteed and are subject to change prior to the December 31, 2024 taxation year-end of the ETFs.
The actual taxable amounts of reinvested distributions for 2024, including the tax characteristics of the distributions, will be reported to brokers through Clearing and Depository Services (CDS) in early 2025.
All values are expressed in Canadian dollars, unless otherwise indicated. The estimated 2024 annual per-unit reinvested distributions for the Bristol Gate ETFs are as follows:
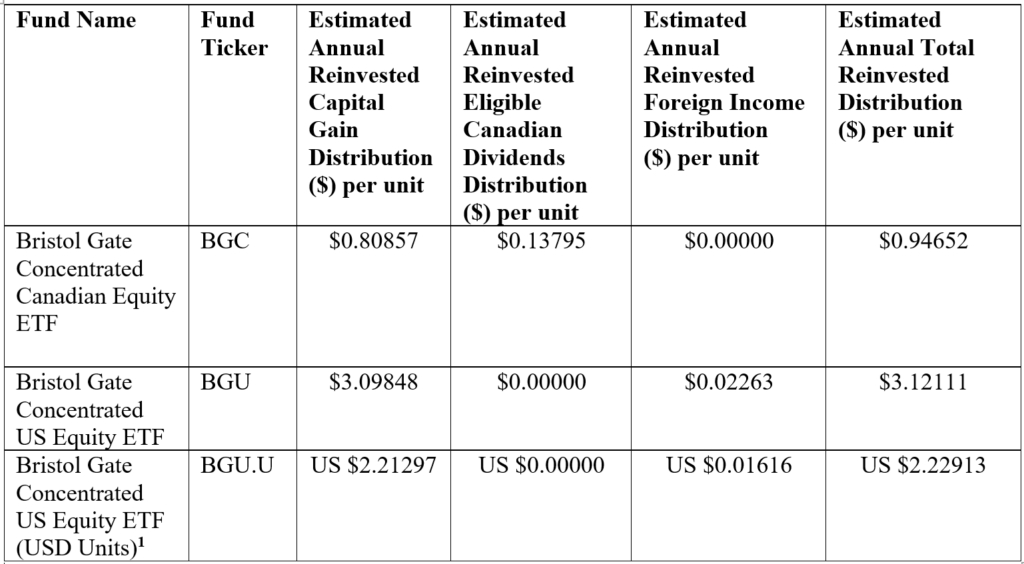
1-Distribution per unit ($) amount is reported in USD for BGU.U converted as at November 29, 2024
Certain statements in this document may contain forward-looking statements that are predictive in nature, that depend upon or refer to future events and conditions or include words such as “may”, “could”, “would”, “should”, “expect”, “anticipate”, “intend”, “plan”, “believe”, “estimate” and similar forward-looking expressions or negative versions thereof.
These forward-looking statements are subject to various risks and uncertainties, including the risks described in the Prospectus of the ETF, uncertainties and assumptions about the ETF, capital markets and economic factors, which could cause actual financial performance and expectations to differ materially from the anticipated performance or other expectations expressed. Economic factors include, but are not limited to, general economic, political and market factors in North America and internationally, interest and foreign exchange rates, global equity and capital markets, business competition, technological change, changes in government regulations, unexpected judicial or regulatory proceedings, and catastrophic events.
Readers are cautioned not to place undue reliance on forward-looking statements and consider the above-mentioned factors and other factors carefully before making any investment decisions. All opinions contained in forward-looking statements are subject to change without notice and are provided in good faith. Forward-looking statements are not guarantees of future performance, and actual results could differ materially from those expressed or implied in any forward-looking statements made by the ETF. The Manager has no specific intention of updating any forward-looking statements whether as a result of new information, future events or otherwise, except as required by securities legislation.
Commissions, management fees and expenses all may be associated with investments in exchange-traded funds (ETFs). Before investing, investors should carefully read the prospectus and ETF facts and carefully consider the investment objectives, risks, charges and expenses of the ETFs. ETFs are not guaranteed; their values change frequently, and past performance may not be repeated. For this and more complete information about the ETFs call 416-921-7076 or visit www.bristolgate.com for the prospectus and ETF facts. Copies of the prospectus and ETF facts are also available on www.sedarplus.ca.
About Bristol Gate Capital Partners Inc.
Bristol Gate Capital Partners is an independent, employee-owned, Toronto-based investment management company serving individual and institutional clients. The firm uses predictive machine learning in combination with fundamental analysis to identify high quality companies that have the capacity and willingness to significantly increase their dividends in the year ahead. Bristol Gate Capital Partners currently manages approximately $3.3 billion in AUM/AUA across a US equity strategy and a Canadian equity strategy and manages an ETF following each strategy. To learn more information, please visit www.bristolgate.com.
For more information, please contact:
Michael Capombassis
President
416-921-7076 x 248
mike.capombassis@bristolgate.com
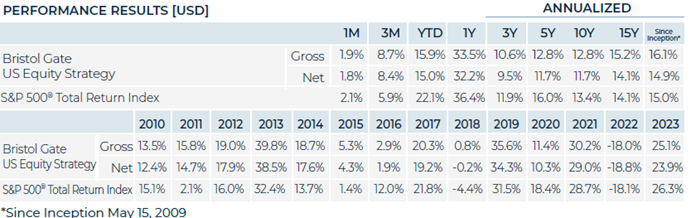
Performance Summary
During the quarter, both the US Equity and Canadian Equity Strategies outperformed their respective benchmarks and continue to outpace the indices in terms of dividend growth. For a more detailed discussion on performance see each Strategy’s respective section below.
Portfolio Dividend Growth – Trailing and consensus forward 12 months.
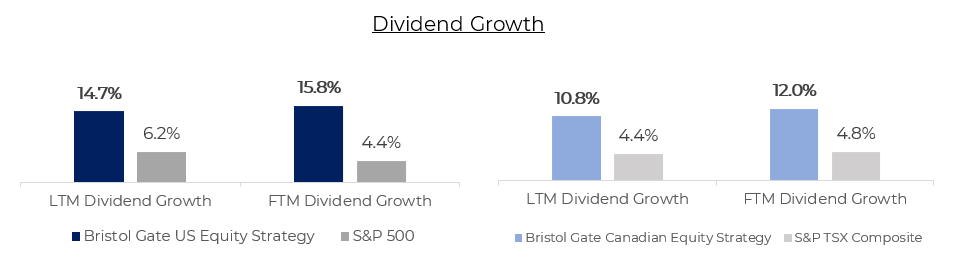
Note: Last 12 months (“LTM”) Dividend Growth is the median of the actual trailing 12-month dividend growth of the individual stocks held by Strategies or Index constituents as reported by Bloomberg as at Sept 30, 2024. Forward 12 months (“FTM”) Dividend Growth is the median of the Bristol Gate Model’s forward 12-month prediction for the individual stocks held by the Strategies and the median of consensus estimates for the constituents of the Indices as of quarter end. Companies without a consensus dividend forecast were excluded.
Source: Bloomberg, FactSet, Bristol Gate Capital Partners.
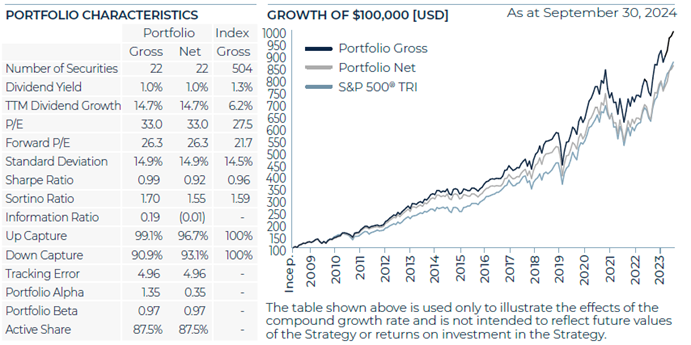
US Equity Strategy
Market Recap
The S&P 500 Index experienced its fourth consecutive quarter of gains, rising by more than 5% during Q3 2024. This strong performance occurred at the onset of a new interest rate easing cycle by the Federal Reserve, which implemented a significant rate cut of 50 basis points in September to support growth and stabilize a slowing labour market. This marked the first easing decision since the onset of the COVID-19 pandemic. The cut, coupled with the central bank’s signaling of further rate reductions, if necessary, generated optimism among investors. Additionally, positive market sentiment was bolstered by strong corporate earnings in the second quarter, which surpassed initial estimates.
Portfolio Results
The US Equity strategy outperformed the benchmark in the period.
Contributors
An overweight position and strong stock selection in Industrials, along with an overweight to Materials and Financials, contributed positively to returns in the period.
On an absolute basis, Sherwin-Williams Co., Carrier Global Corp., and Lowes Inc. were amongst our best performers in the period.
Sherwin-Williams outperformed after posting strong quarterly results and raising their full-year guidance for earnings. The company also held its annual Investor Day in September, highlighting market share gains and productivity improvements during an unfavourable macro environment. Carrier continued to execute along its strategy to become a pure play HVAC company, announcing the sale of its Commercial & Residential Fire business to private equity. Divesting this segment was the last piece of Carrier’s portfolio transformation. Together, with the completed exits of their Industrial Fire and Global Access Solutions business lines and the pending sale of their Commercial Refrigeration unit, Carrier’s four exits total over $10B in value and ~$7.7B in net proceeds, $1-2B higher than our initial expectations when we acquired the shares approximately one year ago. Lowe’s benefited from improved investor sentiment brought by lower interest rates and the implications of that on the housing market.
Detractors
Stock selection in the Information Technology sector detracted from returns in the period. Additionally, the allocation effect in Staples, Utilities and Real Estate sectors detracted from performance. Our strategy is typically underweight these sectors as they offer fewer opportunities to source high dividend growth than others. However, their higher yields attract investors during the onset or rate cutting cycles as we are experiencing today, and they tend to perform well on a relative basis during such periods.
On an absolute basis, McKesson Corp., Applied Materials Inc., and Microchip Technology Inc. were amongst our weakest performers in the period.
McKesson lagged the market after comments from management regarding its fiscal Q2 2025 earnings expectations which were more muted than consensus was expecting. We believe Applied Materials’ decline was largely driven by the headwinds of investors rotating out of the “AI trade” and into other areas of the market. In August, Microchip reported quarterly results that continued to reflect excess customer inventory reductions brought by a slowing economy. We believe we are near the end of the destocking cycle and believe Microchip is well positioned for a potential recovery. We have no long-term fundamental concerns regarding any of these holdings.
Outlook
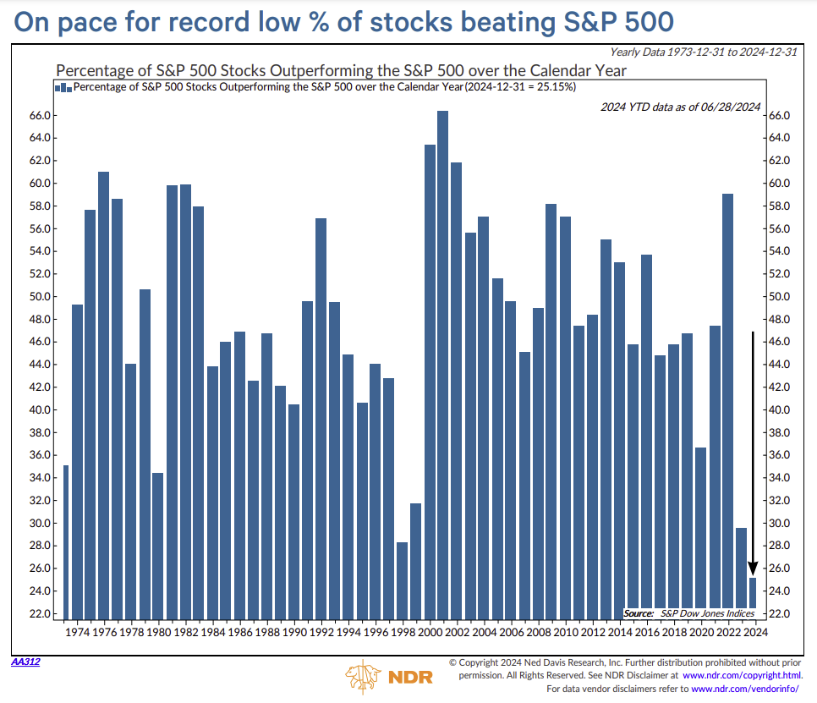
For some time, we and others have been highlighting the concentrated nature of the Index’s returns. At the end of the second quarter, we asked:
- How sustainable is the growth being priced into the “Magnificent Seven”; and
- Are the other 493 companies being appropriately valued if a broad recovery in earnings growth materializes?
Deviating from the Index when concentration was high had historically been a good strategy, and we believed this time would be no different. As shown in Exhibit 1, only about a quarter of the companies in the S&P 500 were outperforming the Index on a year-to-date basis at the end of June. That was significantly below the 47% average between 2010 (the first full year of our US strategy) and 2023. The S&P 500 finally caught its “breadth” in the third quarter with a reversal of the concentration that characterized its returns for the prior year and a half. The percentage of companies in the S&P 500 outperforming the Index improved to 40% on a year-to-date basis with approximately two-thirds of the constituents doing so in Q3 alone.
Exhibit 1. Percentage of S&P 500 Constituents Outperforming the Index
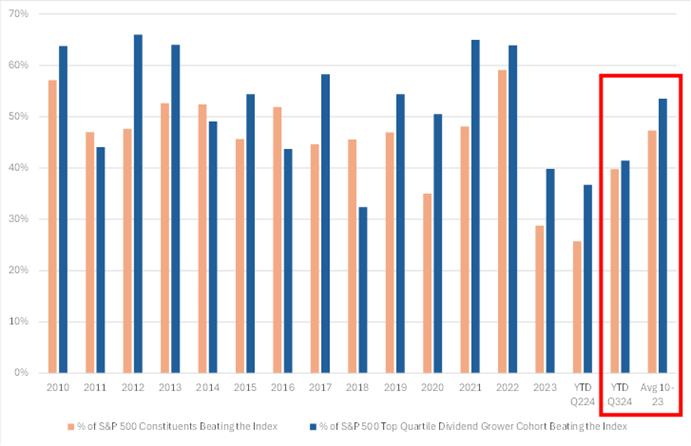
Note: Dividend growth is calculated on a trailing 12-month basis and includes special dividends. Dividend initiators are excluded as these render growth calculations meaningless. The population to determine quartile rankings include all dividend payers (dividend growers, maintainers, and cutters) but exclude initiators. Source: Bloomberg, Bristol Gate Capital Partners.
More relevant to our focus universe, high dividend growers also had a period of abnormal underperformance relative to the Index in the first half of the year. On average, between 2010 and 2023, 54% of the fast dividend growers outperformed the index. As at the end of Q2 2024, 37% of the high dividend growth universe was outperforming the S&P500. By the end of Q3, this number improved to 41%.
Market concentration has had an obvious impact on relative returns. That improvement in market breadth helped us outperform the Index during Q3. But where do we go from here?
At Bristol Gate, we can’t control the index or the economy, and we don’t try to. What we can do is seek to consistently deliver a portfolio of high quality, high dividend growers by owning companies that are confident in their free cash flow growth and prospects looking forward. Reversals can, and do, happen quickly, as we saw in July, and it is important for us to always focus on our process and the fundamentals of the companies we own.
When we look at our portfolio, we see sustainable tailwinds that are helping drive earnings growth, free cash flow growth, and subsequently dividend growth to us as shareholders. This year, 17 of our 22 portfolio companies have already announced dividend increases averaging ~13%, backed up by our portfolio’s earnings and revenue growth of ~12% and ~6%, respectively. We believe consistently generating results such as these will lead to attractive returns over time.
As investor attention turns away from the “Magnificent Seven” with the Index’s earnings growth increasingly driven by the remaining 493 constituents, we believe our high dividend growth universe represents an attractive investment opportunity. Even with the relative improvement our universe experienced in Q3, we remain far below the average percentage of outperformers versus the Index. In the meantime, through portfolio construction, we seek to limit risk and ensure that each of our 22 names maintains an adequate weighting to help drive returns for investors. By staying consistent, we aim to continue to deliver for clients over time.
Source: Bristol Gate Capital Partners. There is a risk of loss inherent in any investment; past performance is not indicative of future results. Please see important disclosures at end of document.
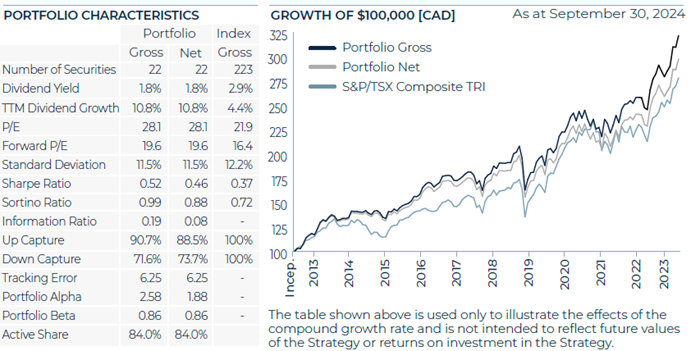
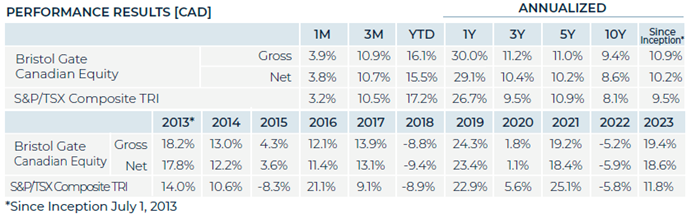
Canadian Equity Strategy
Market Recap
The S&P/TSX Composite Index rose over 10% in the quarter. As economic growth slowed, the Bank of Canada to continued to cut interest rates, which benefited interest-rate sensitive sectors, including Financials, Real Estate and Utilities.
Portfolio Results
The Canadian Equity strategy outperformed the index during the quarter.
Contributors
An overweight to Real Estate and strong stock selection within Consumer Discretionary contributed positively to returns. Additionally, having no exposure to Energy also added to the performance during the period.
On an absolute basis, Colliers International Group, Brookfield Corp., and Jamieson Wellness were amongst our best performers in the period. Colliers performed well as management raised their full-year guidance to account for their acquisition of Englobe. Brookfield Corp. outperformed given the tailwind of falling interest rates. Jamieson outpaced the market as the company posted results that modestly outperformed expectations.
Detractors
Stock selection in the Materials and Information Technology sectors detracted from returns in the period. Additionally, being underweight Financials negatively impacted performance.
On an absolute basis, Alimentation Couche-Tard Inc., Canadian National Railway Co., and Stella-Jones Inc. were amongst our weakest performers in the period. Couche-Tard lagged on speculation of the impact of a potential acquisition of 7-Eleven. CN Rail trailed the index as management slightly lowered their full-year guidance. Stella-Jones underperformed despite continuing to execute well from an operational perspective. We have no long-term fundamental concerns about any of these companies.
Outlook
In a challenging year for the Canadian economy, the market continued to deliver strong absolute returns, which serves as the latest reminder that the market is not the economy.
Our portfolio companies continue to deliver strong fundamental results, as evidenced by their latest quarterly results. 15 portfolio companies have announced dividend increases in 2024, averaging over 12%, and the portfolio in aggregate has a median of ~9% revenue growth and ~13% EPS growth, which compares favourably to the S&P/TSX’s broad results (~13% EPS growth, ~7% revenue growth).
We continue to focus on the companies we own and evaluate potential new holdings that are identified as high dividend growers by our machine learning model. By continuing to stick to our process, we are confident we will continue to be able to navigate whatever comes our way via the economy or markets in both the near and long-term.
Source: Bristol Gate Capital Partners. There is a risk of loss inherent in any investment; past performance is not indicative of future results. Please see important disclosures at end of document.
Firm Update
To all our clients:
Over the past few months, we have been successful in establishing new relationships which will provide future growth for our firm. This is a testament to the fact that there will always be demand for a unique, evidence-based investment approach that provides investors with additional income every year.
As we expand our business it is important that we maintain the highest level of client care. To help manage this, we would like to welcome Elizabeth O’Sullivan to the firm, who joins Bristol Gate as a Relationship Manager.
To all our clients, thank you for your ongoing support and trust. We are determined to do everything we can to provide you income growth and strong investment returns in the future.
Yours sincerely,
The Bristol Gate Team
Important disclosures
There is a risk of loss inherent in any investment; past performance is not indicative of future results. Prospective and existing investors in Bristol Gate’s pooled funds or ETF funds should refer to the fund’s offering documents which outline the risk factors associated with a decision to invest. Separately managed account clients should refer to disclosure documents provided which outline risks of investing. Pursuant to SEC regulations, a description of risks associated with Bristol Gate’s strategies is also contained in Bristol Gate’s Form ADV Part 2A located at www.bristolgate.com/regulatory-documents.
The information contained herein is obtained from multiple sources that are believed to be reliable. However, such information may not have been verified, and may be different from the information included in documents and materials created by a sponsor firm in whose investment program a client participates. Some sponsor firms may require that these Bristol Gate materials are preceded or accompanied by investment profiles or other documents or materials prepared by such sponsor firms, which will be provided upon a client’s request. There may be discrepancies between Bristol Gate’s performance returns and the returns included in a sponsor firm’s profile document (for example, but not limited to, differences in account size/type, portfolio management strategies, the number of securities held, average account size, inclusion of institutional or mutual fund accounts, etc.) For additional information, documents and/or materials, please speak to your Financial Advisor.
US Equity Strategy returns in this report refer to the Bristol Gate US Equity Strategy Composite (the “US Composite”). The US Composite consists of equities of publicly traded, dividend paying US companies. The US Composite is valued in US Dollars and for comparison purposes is measured against the S&P 500 Total Return Index. The US Composite’s Investment Advisor, Bristol Gate Capital Partners Inc., defines itself as a portfolio manager, exempt market dealer and investment fund manager (as per its registration in Ontario, its principal regulator in Canada) and is also a Registered Investment Adviser with the U.S. Securities and Exchange Commission (the “SEC”). The Investment Advisor’s objective is to select companies with positive dividend growth, and which collectively will generate over the long term a growing income and capital appreciation for investors. The inception date of the US Composite is May 15, 2009. The US Dollar is the currency used to measure performance, which is presented on a gross and net basis and includes the reinvestment of investment income. The US Composite’s gross return is gross of withholding tax prior to January 1, 2017 and is net of withholding tax thereafter. Net returns are calculated by reducing the gross returns by the maximum management fee charged by Bristol Gate of 1%, applied monthly. Actual investment advisory fees incurred by clients may vary. There is the opportunity for the use of leverage up to 30% of the net asset value of the underlying investments using a margin account at the prime broker. Thus far no material leverage has been utilized. An investor’s actual returns may be reduced by management fees, performance fees, and other operating expenses that may be incurred because of the management of the US Composite. A performance fee may also be charged on some accounts and funds managed by the firm. Bristol Gate claims compliance with the Global Investment Performance Standards (GIPS®). GIPS® is a registered trademark of CFA Institute. CFA Institute does not endorse or promote this organization, nor does it warrant the accuracy or quality of the content contained herein. To obtain a GIPS Composite Report, please email us at info@bristolgate.com.
The S&P 500® Total Return Index measures the performance of the broad US equity market, including dividend re-investment, in US dollars. This index is provided for information only and comparisons to the index has limitations. The benchmark is an appropriate standard against which the performance of the strategy can be measured over longer time periods as it represents the primary investment universe from which Bristol Gate selects securities. However, Bristol Gate’s portfolio construction process differs materially from that of the benchmark and the securities selected for inclusion in the strategy are not influenced by the composition of the benchmark. For example, the strategy is a concentrated portfolio of approximately equally weighted dividend-paying equity securities, rebalanced quarterly whereas the benchmark is a broad stock index (including both dividend and non-dividend paying equities) that is market capitalization weighted. As such, strategy performance deviations relative to the benchmark may be significant, particularly over shorter time periods. The strategy has concentrated investments in a limited number of companies; as a result, a change in one security’s value may have a more significant effect on the strategy’s value.
SPDR® S&P 500® ETF Trust (SPY US) sourced from Bloomberg has been used as a proxy for the S&P 500® Total Return Index for the purpose of providing non-return-based portfolio statistics and sector weightings in this report. SPY US is an ETF that seeks to provide investment results that, before expenses, correspond generally to the price and yield performance of the S&P 500® Index.
Canadian Equity Strategy returns in this report refer to the Bristol Gate Canadian Equity Strategy Composite (the “Canadian Composite”). The Canadian Composite consists primarily of equities of publicly traded, dividend paying Canadian companies. The Canadian Composite is valued in Canadian Dollars and for comparison purposes is measured against the S&P/TSX. The Canadian Composite’s Investment Advisor, Bristol Gate Capital Partners Inc., defines itself as a portfolio manager, exempt market dealer and investment fund manager (as per its registration in Ontario, its principal regulator in Canada) and is also a Registered Investment Adviser with the U.S. Securities and Exchange Commission (the “SEC”). The Investment Advisor’s objective is to select companies primarily from the S&P/TSX universe with positive dividend growth and which collectively will generate over the long term a growing income and capital appreciation for investors. The inception date of the Canadian Composite is July 1, 2013. Returns are presented gross and net of fees and include the reinvestment of all income. The Canadian composite’s gross return is gross of withholding tax prior to January 1, 2017 and is net of withholding tax thereafter. Net returns are calculated by reducing the gross returns by the maximum management fee charged by Bristol Gate of 0.7%, applied monthly. Actual investment advisory fees incurred by clients may vary. An investor’s actual returns may be reduced by management fees, performance fees, and other operating expenses that may be incurred because of the management of the Canadian Composite. A performance fee may be charged on some accounts and funds managed by the firm. Bristol Gate claims compliance with the Global Investment Performance Standards (GIPS®). GIPS® is a registered trademark of CFA Institute. CFA Institute does not endorse or promote this organization, nor does it warrant the accuracy or quality of the content contained herein. To obtain a GIPS Composite Report, please email us at info@bristolgate.com.
The returns have been converted into Canadian Dollars using month‐end Bank of Canada Closing rates.
The S&P/TSX Total Return Index measures the performance of the broad Canadian equity market, including dividend re-investment, in Canadian dollars. This index has been provided for information only and comparisons to the index has limitations. The benchmark is an appropriate standard against which the performance of the strategy can be measured over longer time periods as it represents the primary investment universe from which Bristol Gate selects securities. However, Bristol Gate’s portfolio construction process differs materially from that of the benchmark and the securities selected for inclusion in the strategy are not influenced by the composition of the benchmark. For example, the strategy is a concentrated portfolio of approximately equally weighted dividend-paying equity securities, rebalanced quarterly whereas the benchmark is a broad stock index (including both dividend and non-dividend paying equities) that is market capitalization weighted. As such, strategy performance deviations relative to the benchmark may be significant, particularly over shorter time periods. The strategy has concentrated investments in a limited number of companies; as a result, a change in one security’s value may have a more significant effect on the strategy’s value.
This Report is for information purposes and should not be construed under any circumstances as a public offering of securities in any jurisdiction in which an offer or solicitation is not authorized. Prospective investors in Bristol Gate’s pooled funds or ETF funds should rely solely on the fund’s offering documents, which outline the risk factors associated with a decision to invest. No representations or warranties of any kind are intended or should be inferred with respect to the economic return or the tax implications of any investment in a Bristol Gate fund.
This piece is presented for illustrative and discussion purposes only. It should not be considered as personal investment advice or an offer or solicitation to buy and/or sell securities and it does not consider unique objectives, constraints, or financial needs of the individual. Under no circumstances does this piece suggest that you should time the market in any way or make investment decisions based on the content. Investors are advised that their investments are not guaranteed, their values change frequently, and past performance may not be repeated. References to specific securities are presented to illustrate the application of our investment philosophy only, do not represent all of the securities purchased, sold or recommended for the portfolio, and it should not be assumed that investments in the securities identified were or will be profitable and should not be considered recommendations by Bristol Gate Capital Partners Inc. A full list of security holdings is available upon request. For more information contact Bristol Gate Capital Partners Inc. directly. The information contained in this piece is the opinion of Bristol Gate Capital Partners Inc. and/or its employees as of the date of the piece and is subject to change without notice. Every effort has been made to ensure accuracy in this piece at the time of publication; however, accuracy cannot be guaranteed. Market conditions may change and Bristol Gate Capital Partners Inc. accepts no responsibility for individual investment decisions arising from the use of or reliance on the information contained herein. We strongly recommend you consult with a financial advisor prior to making any investment decisions. Please refer to the Legal section of Bristol Gate’s website for additional information at bristolgate.com.
A Note About Forward-Looking Statements
This report may contain forward-looking statements including, but not limited to, statements about the Bristol Gate strategies, risks, expected performance and condition. Forward-looking statements include statements that are predictive in nature, that depend upon or refer to future events and conditions or include words such as “may”, “could”, “would”, “should”, “expect”, “anticipate”, “intend”, “plan”, “believe”, “estimate” and similar forward-looking expressions or negative versions thereof.
These forward-looking statements are subject to various risks, uncertainties and assumptions about the investment strategies, capital markets and economic factors, which could cause actual financial performance and expectations to differ materially from the anticipated performance or other expectations expressed. Economic factors include, but are not limited to, general economic, political and market factors in North America and internationally, interest and foreign exchange rates, global equity and capital markets, business competition, technological change, changes in government regulations, unexpected judicial or regulatory proceedings, and catastrophic events.
Readers are cautioned not to place undue reliance on forward-looking statements and consider the above-mentioned factors and other factors carefully before making any investment decisions. All opinions contained in forward-looking statements are subject to change without notice and are provided in good faith. Forward-looking statements are not guarantees of future performance, and actual results could differ materially from those expressed or implied in any forward-looking statements. Bristol Gate Capital Partners Inc. has no specific intention of updating any forward-looking statements whether as a result of new information, future events or otherwise, except as required by securities legislation.
“What’s past is prologue” – Shakespeare, The Tempest
Prudent risk management demands that we try to be aware of as many possible risks that exist in our companies, the market, and subsequently in our client portfolios. Today’s U.S. equity markets have been led by a narrow list of technology stocks which account for an astounding 59% of the S&P 500 return year-to-date. This concentration of return is reminiscent of the New Economy boom of the late 1990s, the PC Era of the 1980s, and other technology booms but with distinct differences. Although today’s price leaders have significantly stronger cash flows than those of the 90s, the growing popularity in passive market exposure through index investing has added another level of potential risk in today’s equity markets.
We believe Bristol Gate has a role to play in any long-term investment portfolio and index concentration may be signaling that it is the right time to add to our unique exposure for a variety of reasons:
- Allocation: Our unique high dividend growth focus is complementary to growth-focused and index strategies.
- Active share: We consistently invest in ideas that are not index-focused, as evidenced by our high Active Share of 87%. This indicates that our portfolio’s holdings differ significantly from those of the benchmark index.
- Performance: Long-term absolute and risk-adjusted metrics show how a dividend growth focused strategy can provide a positive alternative to a mega cap driven market.
The record low percentage of stocks beating the S&P 500 underscores a stark bifurcation within the market: a few stocks, often grouped together as the “Magnificent 7”, are overwhelmingly driving the broad market’s performance. It is not an exaggeration to state that the narrowness of the current market is unprecedented relative to what we have seen in the last 50 years.
Exhibit 1:
Source: Ned Davis
What makes this environment unique from previous markets is that today’s concentration is not centered around hype. The companies driving the market to new highs have delivered staggering earnings growth in an environment of rising interest rates and otherwise muted growth.
Exhibit 2:
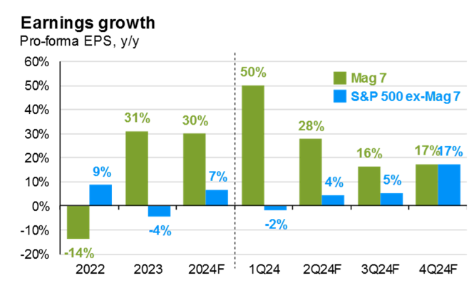
Source: JP Morgan Guide to the Markets (July 2024).
Looking forward, the question for these market leaders is how much of the growth being priced into their stocks is sustainable. On the other hand, are the other 493 companies being fairly valued if an expected broad recovery in earnings growth materializes? Exhibit 3 shows the widening gap between the S&P 500’s performance on a market capitalization weighted basis vs equal weighted basis. This disparity indicates that the largest companies, mostly technology giants, are wielding disproportionate influence over the returns of the index.
Exhibit 3:
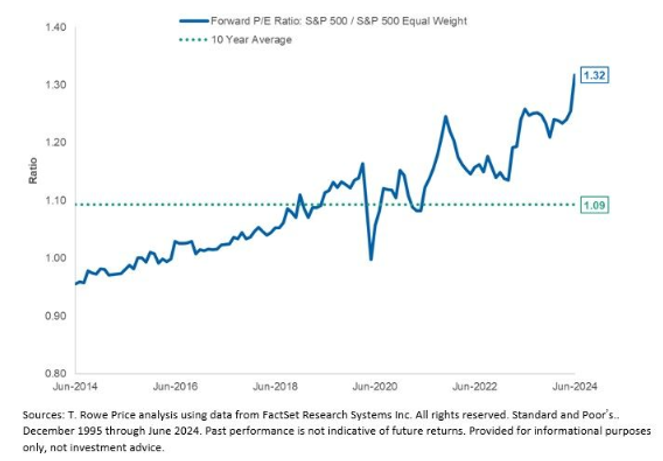
Source: T. Rowe Price
With history as our only guide, we can look back to see how previous instances of companies ascending to such large weights in the index have played out, in terms of concentration and the longevity of that concentration. What we see is that it is unlikely that such levels of concentration last, even as some companies can maintain long periods of dominance.
Exhibit 4:
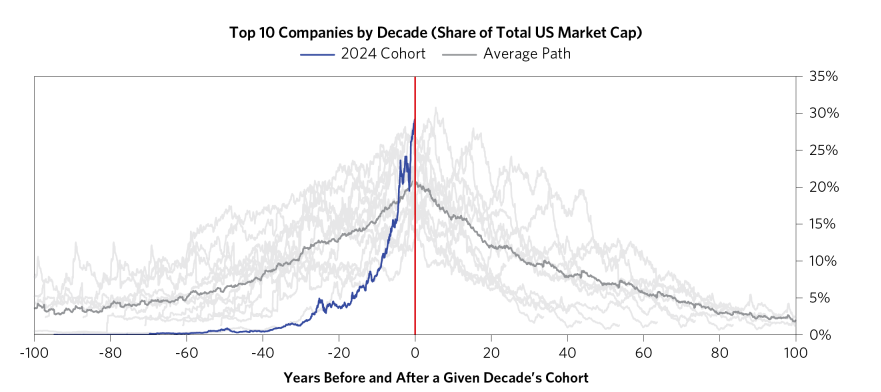
Source: Bridgewater
As we indicated earlier, another key difference between the market in the late 1990s is the seismic shift we have seen from active to passive investing. Over the last 30 years, passive funds have gone from less than 2% to today where these funds own over half the market.
Exhibit 5:
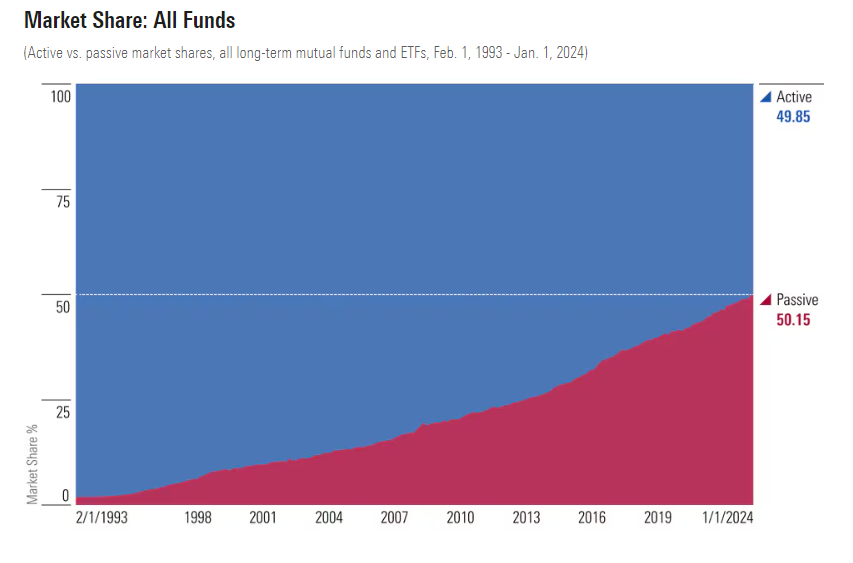
Source: Morningstar
This shift exacerbates the concentration issue, as buying into market cap-weighted indices means investors gain a heavy exposure to these few dominant stocks. As a sector, Information Technology has gone from being 18% of the index in 2001 to over 32% today. Owning the market means investors, consciously or not, own a growth portfolio.
In our view, the solution to this concentrated risk is diversification—not through more concentration but through a thoughtful blend of passive and active management. A strategic rebalancing from passive to active strategies allows investors to benefit from the growth of the stocks driving the market. This approach mitigates the dual risks of being over-concentrated in those few names and missing out on the opportunity to invest in broader market segments that may be undervalued.
Bristol Gate’s focus on high dividend growth offers an exposure to high-quality companies beyond the largest companies. Our US Equity portfolio boasts an Active Share of over 87%, meaning an allocation to our strategy would immediately diversify an investor’s portfolio and reduce exposure to the highest weights in the index.
Owning our portfolio doesn’t require giving up on the most attractive segments in the market. Our portfolio companies all enjoy sustainable tailwinds that are helping drive earnings growth, free cash flow growth, and subsequently dividend growth to us as shareholders:
Exhibit 6:
Source: Bristol Gate Capital Partners
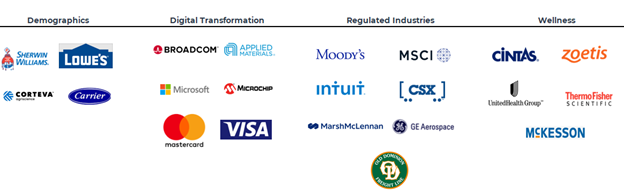
Our portfolio continues to benefit from the vast investments being made in Artificial Intelligence (“AI”) through holdings like Microsoft, Broadcom, Applied Materials, and Microchip Technology, but without owning companies that are trading at nosebleed valuations. Active management benefits from under-recognized fundamentals, a case we believe exists right now. By adjusting allocations away from the most overvalued stocks, investors can safeguard against potential downturns and capitalize on growth opportunities across the wider market.
Important Disclosures: There is a risk of loss inherent in any investment; past performance is not indicative of future results. Prospective and existing investors in Bristol Gate’s pooled funds or ETF funds should refer to the fund’s offering documents which outline the risk factors associated with a decision to invest. Separately managed account clients should refer to disclosure documents provided which outline risks of investing. Pursuant to SEC regulations, a description of risks associated with Bristol Gate’s strategies is also contained in Bristol Gate’s Form ADV Part 2A located at www.bristolgate.com/regulatory-documents.This piece is presented for illustrative and discussion purposes only. It should not be considered as personal investment advice or an offer or solicitation to buy and/or sell securities and it does not consider unique objectives, constraints, or financial needs of the individual. Under no circumstances does this piece suggest that you should time the market in any way or make investment decisions based on the content. Investors are advised that their investments are not guaranteed, their values change frequently, and past performance may not be repeated. References to specific securities are presented to illustrate the application of our investment philosophy only, do not represent all of the securities purchased, sold or recommended for the portfolio, it should not be assumed that investments in the securities identified were or will be profitable and should not be considered recommendations by Bristol Gate Capital Partners Inc. A full list of security holdings is available upon request. For more information contact Bristol Gate Capital Partners Inc. directly. The information contained in this piece is the opinion of Bristol Gate Capital Partners Inc. and/or its employees as of the date of the piece and is subject to change without notice. Every effort has been made to ensure accuracy in this piece at the time of publication; however, accuracy cannot be guaranteed. Market conditions may change and Bristol Gate Capital Partners Inc. accepts no responsibility for individual investment decisions arising from the use of or reliance on the information contained herein. We strongly recommend you consult with a financial advisor prior to making any investment decisions. Please refer to the Legal section of Bristol Gate’s website for additional information at bristolgate.com.
A Note About Forward-Looking Statements: This report may contain forward-looking statements including, but not limited to, statements about the Bristol Gate strategies, risks, expected performance and condition. Forward-looking statements include statements that are predictive in nature, that depend upon or refer to future events and conditions or include words such as “may”, “could”, “would”, “should”, “expect”, “anticipate”, “intend”, “plan”, “believe”, “estimate” and similar forward-looking expressions or negative versions thereof.
These forward-looking statements are subject to various risks, uncertainties and assumptions about the investment strategies, capital markets and economic factors, which could cause actual financial performance and expectations to differ materially from the anticipated performance or other expectations expressed. Economic factors include, but are not limited to, general economic, political and market factors in North America and internationally, interest and foreign exchange rates, global equity and capital markets, business competition, technological change, changes in government regulations, unexpected judicial or regulatory proceedings, and catastrophic events. Readers are cautioned not to place undue reliance on forward-looking statements and consider the above-mentioned factors and other factors carefully before making any investment decisions. All opinions contained in forward-looking statements are subject to change without notice and are provided in good faith. Forward-looking statements are not guarantees of future performance, and actual results could differ materially from those expressed or implied in any forward-looking statements. Bristol Gate Capital Partners Inc. has no specific intention of updating any forward-looking statements whether as a result of new information, future events or otherwise, except as required by securities legislation.
At Bristol Gate, we are committed to integrating leading-edge technology across our firm. Since the beginning, we have believed in using data management techniques to help predict dividend growth. Our prediction journey began in 2009 with a linear regression model. By 2014, access to advanced technology allowed us to begin applying Machine Learning and since 2017, we have been using Artificial Intelligence (AI) to help generate an analytical edge. Our team of data scientists has a long, successful track record of accurately predicting a company’s future dividend growth, which has given us insight into how AI can successfully be integrated into a fund’s investment process.
With the recent surge in popularity of AI and generative technologies, AI has become a buzzword many firms are using to attract investors. It’s crucial for investors to discern between genuine innovation and mere hype. When evaluating a fund or a company that claims to use AI, consider the following:
1. Ask for the AI Model’s Backtest: The backtest results of an AI model should be separate from the portfolio’s performance. A backtest will show you if the AI model effectively addresses the problem it’s supposed to solve.
2. Inquire About Data Preprocessing: Seek to determine a firm’s data handling process: How do they transform raw data for the model? This process can help reveal the sophistication of their approach.
3. Question the AI Model Fine-Tuning: How a firm fine-tunes a model can indicate their commitment to maintaining and improving AI capabilities.
4. Future Roadmap for the AI Model: Continuous improvement is a good sign of a firm’s dedication to leveraging AI effectively and the plans for the model should show this.
5. Model Explanation and Transparency: A reputable firm should be able to explain how their AI model makes its decisions. This transparency is crucial for trust and understanding the model’s reliability.
As you navigate the investment landscape, it’s essential to discern the real AI-driven opportunities from the hype. At Bristol Gate, we pride ourselves on our authentic application of AI. Our approach is about more than just using technology; it’s about intelligent integration to create real value for our investors.
Important Disclosures
There is a risk of loss inherent in any investment; past performance is not indicative of future results. Prospective and existing investors in Bristol Gate’s pooled funds or ETF funds should refer to the fund’s offering documents which outline the risk factors associated with a decision to invest. Separately managed account clients should refer to disclosure documents provided which outline risks of investing. Pursuant to SEC regulations, a description of risks associated with Bristol Gate’s strategies is also contained in Bristol Gate’s Form ADV Part 2A located at www.bristolgate.com/regulatory-documents.
This piece is presented for illustrative and discussion purposes only. It should not be considered as personal investment advice or an offer or solicitation to buy and/or sell securities and it does not consider unique objectives, constraints, or financial needs of the individual. Under no circumstances does this piece suggest that you should time the market in any way or make investment decisions based on the content. Investors are advised that their investments are not guaranteed, their values change frequently, and past performance may not be repeated. References to specific securities are presented to illustrate the application of our investment philosophy only, do not represent all of the securities purchased, sold or recommended for the portfolio, it should not be assumed that investments in the securities identified were or will be profitable and should not be considered recommendations by Bristol Gate Capital Partners Inc. A full list of security holdings is available upon request. For more information contact Bristol Gate Capital Partners Inc. directly. The information contained in this piece is the opinion of Bristol Gate Capital Partners Inc. and/or its employees as of the date of the piece and is subject to change without notice. Every effort has been made to ensure accuracy in this piece at the time of publication; however, accuracy cannot be guaranteed. Market conditions may change and Bristol Gate Capital Partners Inc. accepts no responsibility for individual investment decisions arising from the use of or reliance on the information contained herein. We strongly recommend you consult with a financial advisor prior to making any investment decisions. Please refer to the Legal section of Bristol Gate’s website for additional information at bristolgate.com.
A Note About Forward-Looking Statements
This report may contain forward-looking statements including, but not limited to, statements about the Bristol Gate strategies, risks, expected performance and condition. Forward-looking statements include statements that are predictive in nature, that depend upon or refer to future events and conditions or include words such as “may”, “could”, “would”, “should”, “expect”, “anticipate”, “intend”, “plan”, “believe”, “estimate” and similar forward-looking expressions or negative versions thereof.
These forward-looking statements are subject to various risks, uncertainties and assumptions about the investment strategies, capital markets and economic factors, which could cause actual financial performance and expectations to differ materially from the anticipated performance or other expectations expressed. Economic factors include, but are not limited to, general economic, political and market factors in North America and internationally, interest and foreign exchange rates, global equity and capital markets, business competition, technological change, changes in government regulations, unexpected judicial or regulatory proceedings, and catastrophic events. Readers are cautioned not to place undue reliance on forward-looking statements and consider the above-mentioned factors and other factors carefully before making any investment decisions. All opinions contained in forward-looking statements are subject to change without notice and are provided in good faith. Forward-looking statements are not guarantees of future performance, and actual results could differ materially from those expressed or implied in any forward-looking statements. Bristol Gate Capital Partners Inc. has no specific intention of updating any forward-looking statements whether as a result of new information, future events or otherwise, except as required by securities legislation.
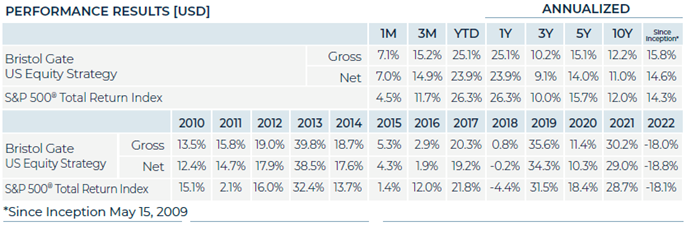
Performance Summary
During the quarter, both the US Equity Strategy and Canadian Equity Strategy outperformed their respective benchmarks net of fees. Both the strategies also continued to outpace their respective benchmarks in terms of dividend growth.
For the full year, the US Equity strategy kept pace with the S&P 500 in a very narrow market, while our Canadian Equity strategy had a strong year relative to the S&P/TSX Composite. For a more detailed discussion on performance see each Strategy’s respective section below.
Portfolio Dividend Growth – Trailing and consensus forward 12 months.
Note: Last 12 months (“LTM”) Dividend Growth is the median of the actual trailing 12-month dividend growth of the individual stocks held by Strategies or Index constituents as reported by Bloomberg as at Dec 31, 2023. Forward 12 months (“FTM”) Dividend Growth is the median of the Bristol Gate Model’s forward 12-month prediction for the individual stocks held by the Strategies and the median of consensus estimates for the constituents of the Indices as of quarter end. Companies without a consensus dividend forecast were excluded. Return commentary based on gross returns.
Source: Bloomberg, FactSet, Bristol Gate Capital Partners.
Trust the Process
A year ago, the S&P 500 had just experienced its worst year since the Global Financial Crisis. There were widespread concerns that high interest rates and inflation would lead to a recession and that markets would continue to suffer as a result. Suffice it to say, in 2023 the market zigged while most expected it to zag. The S&P 500 finished the year up over 26%.
In our 2022 year-end client letter, following the challenging year, we counseled that investors zoom out and focus on the bigger picture. We wrote:
From our perspective, times like these offer attractive opportunities for long-term investors. Valuations have been reset. Inflation, while persistent, appears to have peaked. The Fed is likely closer to the end of the hiking cycle than the beginning. An economic recession sometime in 2023 has become a consensus view and markets have already discounted some of that. Although we continue to believe 2023 consensus expectations for double digit earnings growth for the broader market look optimistic considering slowing economic growth and rising costs, we are not investing in the entire market. We are looking for 22 companies that can grow their dividends at
above average rates on the back of solid underlying fundamentals. Our disciplined process and philosophy aim to eliminate the noise market volatility creates and instead take advantage of it. There is a broader offering of investment opportunities available at more attractive valuations than existed a year ago, and we enter the new year enthusiastic about the future for our clients.
Much like Sam Hinkie and his rebuild of the Philadelphia 76ers, we asked investors to “trust the process”, not the outcome after a difficult 2022. That trust was seemingly rewarded in 2023.
In an environment of slow growth and the relative return headwind from not owning six of the “Magnificent Seven” stocks (either due to no dividend payments or subpar dividend growth), our portfolio and the companies within it have distinguished themselves through their better operating results than their dividend peers and having experienced much less multiple expansion and/or much better operating performance than the market.
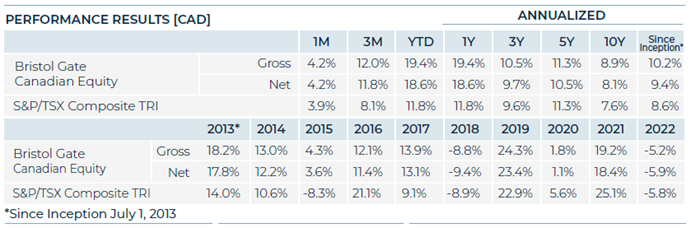
Exhibit 1. 2023 Returns.
Source: Bristol Gate Capital Partners, Morningstar Direct.
While we are proud of our results in 2023, we never put too much stock in short term returns. How our strategy performs over the long-term matters much more. From that perspective, our formula has worked for almost 15 years now. As Exhibit 2 shows, over that time frame, our high dividend growth focus has consistently performed at the top relative to our peer group of dividend and income strategies and produced results that have been competitive with the Index across various time periods. We have achieved this despite not being able to own many of the non dividend paying tech and tech related companies that have created so much value in the Index over the past 15 years.
Exhibit 2. Returns Over Various Time Periods
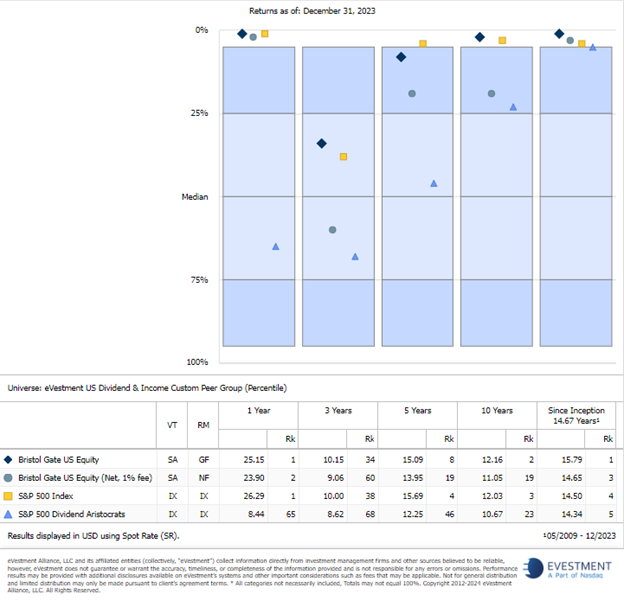
Note: The eVestment US Dividend & Income Peer Group is a custom universe we have created based on a review of long-only dividend and/or equity income focused US large-cap strategies within the eVestment database. Bristol Gate Capital Partners Inc. pays a licensing fee to eVestment to access their database. As at Jan 16, 2024.
We believe our long-term track record is a testament to our differentiated approach to dividend investing, taking advantage of structural market inefficiencies and using our investment process to create a competitive advantage.
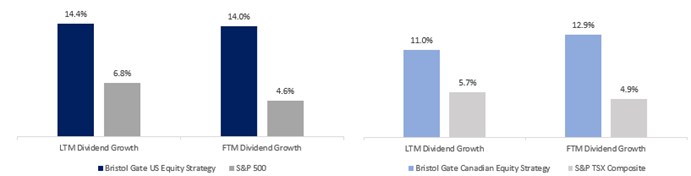
We are singularly focused on high and sustainable dividend growth.
Everything we do is centered around high dividend growth and the underlying factors that can maintain it. In 2023, our portfolio companies delivered dividend increases of ~14%, well above the Index constituent average increase of ~7% and the actual S&P 500 Index cash dividend increase of less than 5%.
Exhibit 3. Trailing 12 Month Dividend Growth
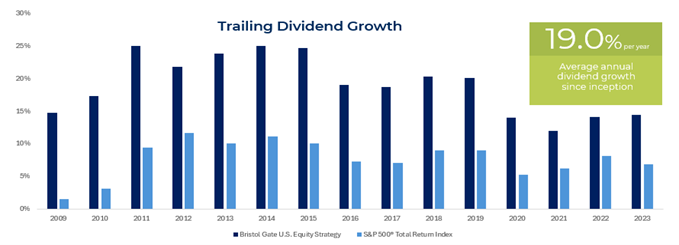
Note: As at December 31, 2023. Trailing dividend growth is median of the annual trailing 12-month dividend growth (as reported on Bloomberg) of the individual stocks held at the end of each calendar year.
Source: Bloomberg, Bristol Gate Capital Partners.
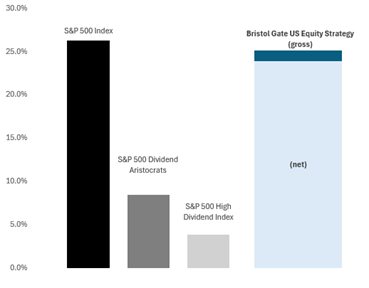
We are yield agnostic and do not compromise on quality.
Rather than requiring a minimum yield, our focus on high dividend growth as opposed to high dividend yield is a key differentiator that we believe leads to better long-term results. Often companies that are paying high yields do so in an unsustainable manner, with excessive payout ratios or dividend payments propped up with the use of leverage. We ignore those companies and instead focus on the ones that have low payout ratios, low leverage, who share a little bit of the strong cash flow they generate with us as investors, but more importantly, reinvest the bulk of it back into their businesses to drive that cash flow and dividend higher over time.
Exhibit 4. Bristol Gate’s Focus
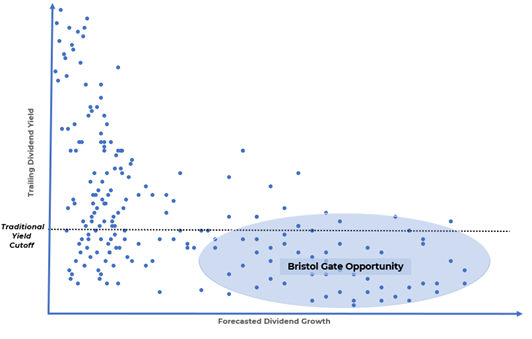
Source: Bristol Gate Capital Partners.
Our process demands conviction.
We are not trying to be everything to everyone. We are looking for 22 stocks that meet our stringent requirements and we give each of them an equal weight in our portfolio. When those stocks exceed certain threshold weights, they are automatically rebalanced back to target weight on a quarterly basis.
That automatic rebalancing is an inherently contrarian mechanism within our process that has several positive outcomes. It allows us to stick with our winners over a long period of time without them becoming a big portfolio risk in themselves. It allocates to our laggards during periods when they are out of favour, increasing the internal rate of return on those investments versus a buy and hold strategy. Lastly, and perhaps most importantly, if forces us to have an honest conversation with ourselves when a holding is not meeting our expectations and decide if it deserves to remain in the portfolio or not.
Exhibit 5. Bristol Gate Rebalancing Approach
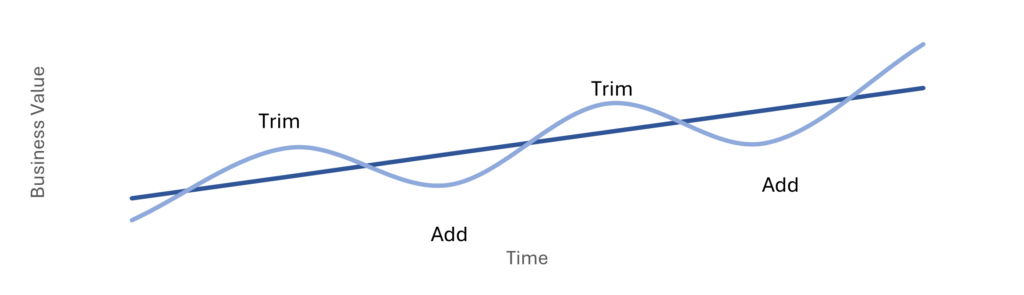
Source: Bristol Gate Capital Partners
We look to continuously improve our process.
We are not dogmatic about our process and critically evaluate each element of what we do in hopes of identifying a better way and improving our return potential. Our firm embraced machine learning in 2017, long before OpenAI’s Chat GPT made Artificial Intelligence a buzz word. We did so because it improved our chances of success by producing more accurate dividend growth predictions than the model we were using at the time. We are currently working on a number of projects across stock selection, portfolio construction and trading that we hope will be additive to our return opportunity in the future.
Summary
This coming year will see our US Equity Strategy reach the milestone of a 15-year track record. Over that timeframe, our process has withstood a variety of economic environments, whether it be falling or rising interest rates, economic expansion or contraction, geopolitical events, and a global pandemic. We continue not to guess where the macro environment is heading and instead trust our process. We remain confident that whatever the coming year may have in store for us, our clients and partners will benefit from our approach over the long term. Our approach is unchanged: build a portfolio of high-quality companies that can grow their dividends at high rates and buy them at reasonable prices. That strategy has served our investors well, and their dividend income has also risen substantially. We do not see why the factors that led to that performance should change in the future and look forward to continuing to compound our investors income and wealth.
US Equity Strategy
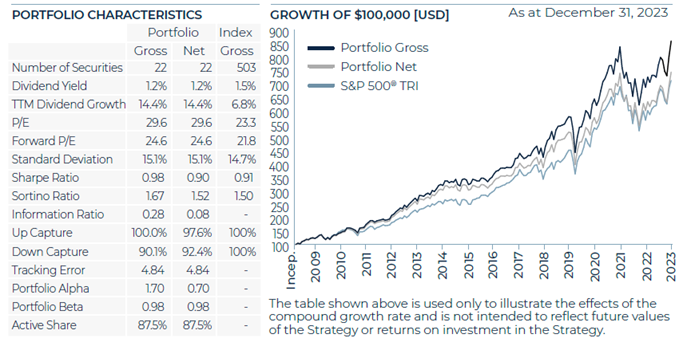
Source: Bristol Gate Capital Partners. There is a risk of loss inherent in any investment; past performance is not indicative of future results. Please see important disclosures at end of document.
Market Recap:
After declining in the third quarter, the S&P 500 closed out the year with a strong Q4, rising by over 11%. The rally was underpinned by inflation easing and the Federal Reserve signaled it could start cutting interest rates in 2024 if inflation continued to fall.
From a fundamental perspective, earnings growth continues to be slow for the broad market with FactSet forecasting flat earnings y/y for the S&P 500 in Q4/23. This is expected to accelerate to 11.4% in 2024. The brighter outlook, combined with a more dovish Fed led to wider breadth in the market. After being driven by a handful of stocks for the first nine months of the year, the last quarter was the only one in 2023 where the equal-weighted S&P 500 outperformed the market-cap weighted index.
Portfolio Results:
The US Equity strategy outperformed the benchmark during the quarter net of fees. For the year, the portfolio underperformed the S&P 500, although it performed very well relative to our investable universe of dividend-paying stocks.
Contributors:
Both overweight and stock selection in Industrials, stock selection in Information Technology and no exposure to Energy contributed to the portfolio’s outperformance.
On an absolute basis, Broadcom, American Tower and Cintas were amongst our best performers in the quarter.
For the year, stock selection in Financials contributed to returns. The portfolio benefited by having no exposure to Energy and Utilities and both allocation and selection effects in Health Care and Industrials also contributed to returns.
Detractors:
Stock selection in Consumer Discretionary and both overweight and stock selection in Materials detracted from returns in the quarter.
On an absolute basis, Corteva, Activision Blizzard and UnitedHealth Group were among the weakest performers.
For the year, the largest detractor was not owning six out of the “Magnificent Seven” group of companies, as they either did not pay a dividend or meet our criteria for dividend growth. Stock selection in Consumer Discretionary and Consumer Staples detracted from returns, as did allocation and selection effects in Communication Services and Materials.
Transactions:
During the quarter, with the cash received from Microsoft’s acquisition of Activision Blizzard in October, we initiated a new position in Carrier Global Corporation at a 4.5% weight and increased our positions in Thermo Fisher Scientific, Sherwin-Williams and Lowe’s back to target weight.
Carrier is a leading global provider of Heating, Ventilation and Air Conditioning (HVAC) and refrigeration solutions. We believe the business is positioned to deliver attractive dividend growth supported by solid underlying fundamentals.
HVAC is an attractive industry, historically growing at two times the rate of industrial production, fueled by long-term sustainability megatrends and a growing global middle class. The industry enjoys the benefits of a significant portion of its revenues coming from repair and replacement activities, buffering sales relative to other industrial segments during periods of economic weakness. Lastly, Carrier is trading at a meaningful discount to its HVAC peers, a valuation gap we expect to close as it becomes more of a pure play HVAC company, exiting certain non-HVAC businesses and integrating its acquisition of Viessmann Climate Solutions, a European heat pump business.
In this regard, management recently announced agreements to sell its global commercial refrigeration business to Haier for an enterprise value of approximately $800 million and its security business to Honeywell for an enterprise value of approximately $5 billion. The sales prices represented transaction multiples of 16.5x and approximately 17x 2023 expected EBITDA, respectively and were comfortably above our expectations, indicating the value in Carrier’s portfolio.
The proceeds from the disposition will help the company pay down debt from their Viessmann deal and reach their committed leverage target quicker, allowing them to resume share buybacks.
Outlook:
In an environment of slow growth and the relative return headwind from not owning six of the “Magnificent Seven” stocks (either due to no dividend payments or subpar dividend growth), our portfolio companies have distinguished themselves through their operating results.
Exhibit 7. Bristol Gate US Equity Portfolio Metrics vs S&P 500 Index
Source: Bristol Gate Capital Partners, Bloomberg
The entire market’s gain for 2023 can be attributed to multiple expansion as earnings are expected to be down for 2023. In contrast, our collection of high dividend growth, high quality businesses experienced significantly less multiple expansion than the market, accounting for less than a third of our return for the year. Said another way, relative to the market, we believe consensus expectations have set the operating hurdle for 2024 much lower for our holdings. If they continue operating as they have, and we see no reason for that to change, it should result in a good outcome for our investors. The broad market on the other hand must deliver a significant increase in earnings to justify the multiple expansion it was awarded in 2023.
Canadian Equity Strategy
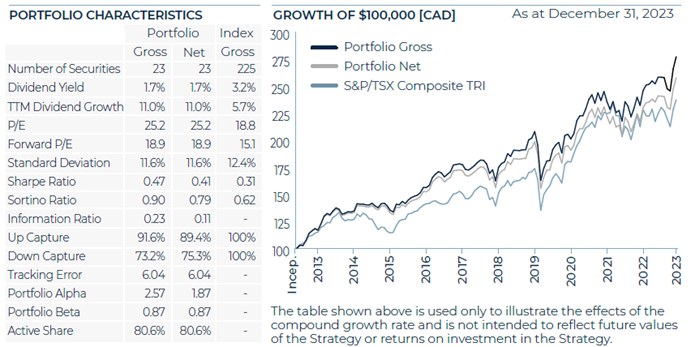
Source: Bristol Gate Capital Partners. There is a risk of loss inherent in any investment; past performance is not indicative of future results. Please see important disclosures at end of document.
Market Recap:
The S&P/TSX Composite rose over 8% in the quarter. After GDP contracted in the third quarter, the Bank of Canada maintained their policy rates during Q4 to try and continue to support domestic growth.
Portfolio Results:
The Canadian Equity strategy outperformed the benchmark during the quarter and added considerable value above the benchmark for the year. We view the long-term results of the strategy relative to the S&P/TSX Composite as validation that a high-quality portfolio of high dividend growth stocks can outperform the market over the long-term.
Contributors:
Having no exposure to the Energy sector as well as both selection and allocation effects in Materials, Consumer Staples and Real Estate contributed to the portfolio’s outperformance.
On an absolute basis, Jamieson Wellness, Colliers International and Brookfield were amongst our best performers in the quarter.
For the year, the portfolios underweight to and stock selection within the Materials sector, stock selection in Real Estate and Financials and the lack of exposure to the Energy sector were the primary contributors to outperformance.
Detractors:
The underweight to Financials, and stock selection in the Information Technology sector detracted from returns in the quarter.
On an absolute basis, Premium Brands Holdings, Dollarama and Intact Financial were among the weakest performers.
For the year, stock selection in Information Technology was the largest detractor from returns.
Transactions:
There were no material transactions for the Canadian strategy in Q4.
Firm Update
During the past year we continued to make progress at the firm level by welcoming back Vincent Racine to the Data Science Team and Aman Dhaliwal to the Sales and Marketing Team. Both had been co-op students with us in the past and after completing their degrees decided to return to Bristol Gate. We are delighted with their decisions.
On the business side we had a busy and productive year and were successful earning the right to be represented on a couple of significant SMA platforms at major distribution firms in Canada. We have increased our efforts in the US by contracting with 2 separate firms to represent us there and we hope to have continued success in both markets moving forward.
To all our clients, thank you for your ongoing support and trust. We are determined to do everything we can to provide you income growth and strong investment returns in the future.
Sincerely, The Bristol Gate Team
Important disclosures
There is a risk of loss inherent in any investment; past performance is not indicative of future results. Prospective and existing investors in Bristol Gate’s pooled funds or ETF funds should refer to the fund’s offering documents which outline the risk factors associated with a decision to invest. Separately managed account clients should refer to disclosure documents provided which outline risks of investing. Pursuant to SEC regulations, a description of risks associated with Bristol Gate’s strategies is also contained in Bristol Gate’s Form ADV Part 2A located at www.bristolgate.com/regulatory-documents.
US Equity Strategy returns in this report refer to the Bristol Gate US Equity Strategy Composite (the “Composite”). The Composite consists of equities of publicly traded, dividend paying US companies. The Composite is valued in US Dollars and for comparison purposes is measured against the S&P 500 Total Return Index. The composite’s Investment Advisor, Bristol Gate Capital Partners Inc., defines itself as a portfolio manager, exempt market dealer and investment fund manager (as per its registration in Ontario, its principal regulator in Canada) and is also a Registered Investment Adviser with the U.S. Securities and Exchange Commission (the “SEC”). The Investment Advisor’s objective is to select companies with positive dividend growth, and which collectively will generate over the long term a growing income and capital appreciation for investors. The inception date of the Composite is May 15, 2009. The US Dollar is the currency used to measure performance, which is presented on a gross and net basis and includes the reinvestment of investment income. The composite’s gross return is gross of withholding tax prior to January 1, 2017 and is net of withholding tax thereafter. Net returns are calculated by reducing the gross returns by the maximum management fee charged by Bristol Gate of 1%, applied monthly. Actual investment advisory fees incurred by clients may vary. There is the opportunity for the use of leverage up to 30% of the net asset value of the underlying investments using a margin account at the prime broker. Thus far no material leverage has been utilized. An investor’s actual returns may be reduced by management fees, performance fees, and other operating expenses that may be incurred because of the management of the composite. A performance fee may also be charged on some accounts and funds managed by the firm. Bristol Gate claims compliance with the Global Investment Performance Standards (GIPS®). GIPS® is a registered trademark of CFA Institute. CFA Institute does not endorse or promote this organization, nor does it warrant the accuracy or quality of the content contained herein. To obtain a GIPS Composite Report, please email us at info@bristolgate.com.
The S&P 500® Total Return Index measures the performance of the broad US equity market, including dividend re-investment, in US dollars. This index is provided for information only and comparisons to the index has limitations. The benchmark is an appropriate standard against which the performance of the strategy can be measured over longer time periods as it represents the primary investment universe from which Bristol Gate selects securities. However, Bristol Gate’s portfolio construction process differs materially from that of the benchmark and the securities selected for inclusion in the strategy are not influenced by the composition of the benchmark. For example, the strategy is a concentrated portfolio of approximately equally weighted dividend-paying equity securities, rebalanced quarterly whereas the benchmark is a broad stock index (including both dividend and non-dividend paying equities) that is market capitalization weighted. As such, strategy performance deviations relative to the benchmark may be significant, particularly over shorter time periods. The strategy has concentrated investments in a limited number of companies; as a result, a change in one security’s value may have a more significant effect on the strategy’s value.
S&P 500 ® Total Return Dividend Aristocrats Index measures the performance of a subset of S&P 500® Index companies that have increased their dividends every year for the last 25 consecutive years. This Index has limited relevancy to our approach as it focuses on historical dividend growth, whereas Bristol Gate’s US Equity strategy’s securities are selected based on future dividend growth.
S&P 500 ® High Dividend Index is designed to measure the performance of 80 high yield companies within the S&P 500 and is equally weighted to best represent the performance of this group, regardless of constituent size. This Index has
limited relevancy to our approach as it focuses on dividend yield, whereas Bristol Gate’s US Equity strategy’s securities are selected based on future dividend growth.
SPDR® S&P 500® ETF Trust (SPY US) sourced from Bloomberg has been used as a proxy for the S&P 500® Total Return Index for the purpose of providing non-return-based portfolio statistics and sector weightings in this report. SPY US is an ETF that seeks to provide investment results that, before expenses, correspond generally to the price and yield performance of the S&P 500® Index.
Canadian Equity Strategy returns in this report refer to the Bristol Gate Canadian Equity Strategy Composite (the “Composite”). The Composite consists primarily of equities of publicly traded, dividend paying Canadian companies.
The Composite is valued in Canadian Dollars and for comparison purposes is measured against the S&P/TSX. The composite’s Investment Advisor, Bristol Gate Capital Partners Inc., defines itself as a portfolio manager, exempt market dealer and investment fund manager (as per its registration in Ontario, its principal regulator in Canada) and is also a Registered Investment Adviser with the U.S. Securities and Exchange Commission (the “SEC”). The Investment Advisor’s objective is to select companies primarily from the S&P/TSX universe with positive dividend growth and which collectively will generate over the long term a growing income and capital appreciation for investors. The inception date of the Composite is July 1, 2013. Returns are presented gross and net of fees and include the reinvestment of all income. The composite’s gross return is gross of withholding tax prior to January 1, 2017 and is net of withholding tax thereafter. Net returns are calculated by reducing the gross returns by the maximum management fee charged by Bristol Gate of 0.7%, applied monthly. Actual investment advisory fees incurred by clients may vary. An investor’s actual returns may be reduced by management fees, performance fees, and other operating expenses that may be incurred because of the management of the composite. A performance fee may be charged on some accounts and funds managed by the firm. Bristol Gate claims compliance with the Global Investment Performance Standards (GIPS®). GIPS® is a registered trademark of CFA Institute. CFA Institute does not endorse or promote this organization, nor does it warrant the accuracy or quality of the content contained herein. To obtain a GIPS Composite Report, please email us at info@bristolgate.com.
The returns have been converted into Canadian Dollars using month‐end Bank of Canada Closing rates.
The S&P/TSX Total Return Index measures the performance of the broad Canadian equity market, including dividend re-investment, in Canadian dollars. This index has been provided for information only and comparisons to the index has limitations. The benchmark is an appropriate standard against which the performance of the strategy can be measured over longer time periods as it represents the primary investment universe from which Bristol Gate selects securities. However, Bristol Gate’s portfolio construction process differs materially from that of the benchmark and the securities selected for inclusion in the strategy are not influenced by the composition of the benchmark. For example, the strategy is a concentrated portfolio of approximately equally weighted dividend-paying equity securities, rebalanced quarterly whereas the benchmark is a broad stock index (including both dividend and non-dividend paying equities) that is market capitalization weighted. As such, strategy performance deviations relative to the benchmark may be significant, particularly over shorter time periods. The strategy has concentrated investments in a limited number of companies; as a result, a change in one security’s value may have a more significant effect on the strategy’s value.
iShares Core S&P®/TSX® Capped Composite Index ETF (XIC CN) sourced from Bloomberg has been used as a proxy for the S&P®/TSX® Total Return Index for the purpose of providing non-return-based portfolio statistics and sector weightings in this report. XIC CN is an ETF that seeks long-term capital growth by replicating the performance of the S&P®/TSX® Capped Composite Index, net of expenses.
This Report is for information purposes and should not be construed under any circumstances as a public offering of securities in any jurisdiction in which an offer or solicitation is not authorized. Prospective investors in Bristol Gate’s pooled funds or ETF funds should rely solely on the fund’s offering documents, which outline the risk factors associated
with a decision to invest. No representations or warranties of any kind are intended or should be inferred with respect to the economic return or the tax implications of any investment in a Bristol Gate fund.
This piece is presented for illustrative and discussion purposes only. It should not be considered as personal investment advice or an offer or solicitation to buy and/or sell securities and it does not consider unique objectives, constraints, or financial needs of the individual. Under no circumstances does this piece suggest that you should time the market in any way or make investment decisions based on the content. Investors are advised that their investments are not guaranteed, their values change frequently, and past performance may not be repeated. References to specific securities are presented to illustrate the application of our investment philosophy only, do not represent all of the securities purchased, sold or recommended for the portfolio, and it should not be assumed that investments in the securities
identified were or will be profitable and should not be considered recommendations by Bristol Gate Capital Partners Inc. A full list of security holdings is available upon request. For more information contact Bristol Gate Capital Partners Inc. directly. The information contained in this piece is the opinion of Bristol Gate Capital Partners Inc. and/or its employees as of the date of the piece and is subject to change without notice. Every effort has been made to ensure accuracy in this piece at the time of publication; however, accuracy cannot be guaranteed. Market conditions may change and Bristol Gate Capital Partners Inc. accepts no responsibility for individual investment decisions arising from the use of or reliance on the information contained herein. We strongly recommend you consult with a financial advisor prior to making any investment decisions. Please refer to the Legal section of Bristol Gate’s website for additional information at bristolgate.com.
A Note About Forward-Looking Statements
This report may contain forward-looking statements including, but not limited to, statements about the Bristol Gate strategies, risks, expected performance and condition. Forward-looking statements include statements that are predictive in nature, that depend upon or refer to future events and conditions or include words such as “may”, “could”, “would”, “should”, “expect”, “anticipate”, “intend”, “plan”, “believe”, “estimate” and similar forward-looking expressions or negative versions thereof.
These forward-looking statements are subject to various risks, uncertainties and assumptions about the investment strategies, capital markets and economic factors, which could cause actual financial performance and expectations to differ materially from the anticipated performance or other expectations expressed. Economic factors include, but are not limited to, general economic, political and market factors in North America and internationally, interest and foreign exchange rates, global equity and capital markets, business competition, technological change, changes in government regulations, unexpected judicial or regulatory proceedings, and catastrophic events.
Readers are cautioned not to place undue reliance on forward-looking statements and consider the above-mentioned factors and other factors carefully before making any investment decisions. All opinions contained in forward-looking statements are subject to change without notice and are provided in good faith. Forward-looking statements are not guarantees of future performance, and actual results could differ materially from those expressed or implied in any forward-looking statements. Bristol Gate Capital Partners Inc. has no specific intention of updating any forward-looking statements whether as a result of new information, future events or otherwise, except as required by securities legislation.
 Takes 2 minutes
Annual Letter to Investors – 2024
In 2024, the S&P 500 Total Return Index delivered its second consecutive 25%+ annual return. Market concentration was the theme of the strong performance, with the top 10 stocks in the Index accounting for more than 60% of the year’s return and almost 40% of the Index market capitalization as at year end. Our US Equity strategy, which focuses on companies with sustainable and fast-growing dividend streams, had limited exposure to these market leaders by design.
Over the past year, strategies that were focused on investing in dividend growth stocks, like Bristol Gate’s, underperformed the S&P 500 Index. This includes the S&P Dividend Aristocrats Index, a collection of companies in the S&P 500 that have increased their dividends for at least 25 consecutive years, which only increased 7.1% in 2024.
Exhibit 1. 2024 Market Concentration.
Source: JP Morgan Asset Management, Guide to the Markets Q4/24.
Strategies that pursued broader diversification, such as the S&P 500 Equal Weight Index, also underperformed the S&P 500 Index (weighted by market capitalization). The Equal Weight Index was up by approximately 13% in 2024.
Exhibit 2. Q4-2024 and 2024 Returns.
Source: S&P Global, Bristol Gate Capital Partners.
The combination of dividend growth and equal weighting strategies underperforming helps contextualize our largest relative underperformance compared to the S&P 500 Index since our strategy’s inception in 2009.
Like any investor, we are not happy with this underperformance and expect better for our investors and from ourselves. While we are disappointed, it is important to place these results within the broader framework of market history and our long-term investment philosophy.
The Nature of Market Cycles and Concentrated Returns
Periods of concentrated market returns are not new and are usually a difficult time for active managers who build well-diversified portfolios of stocks. The last time the S&P 500 delivered consecutive years of 25%+ returns was 1997 and 1998, during the Dotcom boom. During that period, a small number of high-flying technology companies drove the market to unprecedented levels. Investors gravitated towards businesses with explosive revenue growth, often at the expense of fundamentals like profitability and cash flow.
Following the Dotcom bust, many of those technology darlings of the late 1990s experienced steep declines, while dividend-paying stocks, and more specifically dividend growth stocks, provided stability and meaningful returns during the subsequent decade-long stock market recovery.
In Exhibit 3 below, we use the S&P 500 Dividend Aristocrats Index and the S&P 500 Equal Weight Index as proxies for the dividend growth universe and broader diversification, respectively, to show how diversification and dividend growth have fared over time relative to the S&P 500 Index.
Exhibit 3. The Long-Term Outperformance of the S&P 500 Equal Weighted Index and S&P 500 Dividend Aristocrats Index versus the S&P 500 Index.
Source: Bloomberg, S&P Global, Bristol Gate Capital Partners. There is a risk of loss inherent in any investment; past performance is not indicative of future results. Data from January 1990 to December 2024.
Today’s concentration is being largely driven by one underlying theme, artificial intelligence. While it’s tempting to focus on what’s currently working in the market, history shows that concentration does not last forever. Markets reward durable businesses that generate cash over time and maintain their investing discipline through difficult periods.
Why We Believe in High Dividend Growth Stocks
Our investment approach is built on the belief that companies with strong free cash flow, disciplined capital allocation, and a track record of growing their dividends at high rates are uniquely positioned to deliver superior risk-adjusted returns over time. These businesses tend to exhibit resilient operating performance across economic cycles and align management incentives with shareholder interests through sustainable dividend policies.
We believe dividend growth rates are good predictors of returns over time and that the fastest dividend growers should produce even better results than the broader dividend growth universe. Our extensive research confirms this, and it is the reason our investment process begins with using artificial intelligence to find the fastest dividend growers of tomorrow.
Exhibit 4. S&P 500 Returns Compared to Earnings, Dividend and US GDP Growth
Source: US Bureau of Economic Analysis, Robert Shiller, Aswath Damodaran, Bristol Gate Capital Partners. Chart uses logarithmic scale. Data from January 1946 to December 2024
We believe dividend growth rates are a reasonable proxy for earnings growth and because dividends are relatively stable, they are more predictable than earnings, whose volatility makes them more difficult to forecast.
Looking Ahead
Exhibit 5 demonstrates the annual performance of the following groups of stocks relative to the S&P 500:
• The top 65 stocks of prospective dividend growers in the S&P 500 as predicted by our proprietary machine learning model as at each prior year end (“Bristol Gate Top 65”). This universe is time limited to 1999, when the history of our model’s predictions begins (although we would have expected underperformance in 1998 as well);
• The S&P 500 Dividend Aristocrats Index; and
• The S&P 500 Equal Weight Index.
Exhibit 5. The High Dividend Growth Opportunity.
Source: Bristol Gate, Bloomberg, S&P Global in USD. Data from January 1991 to December 2024. There is a risk of loss inherent in any investment; past performance is not indicative of future results.
What is interesting from the exhibit above is that both the Dividend Aristocrats and Equal Weight Indexes outperformed the S&P 500 over the entire 35-year period despite underperforming in more than half the years. This suggests that over time there are probably better ways to make capital allocation decisions than those based on market capitalization.
What’s more compelling to us, is the high dividend growth universe achieved outstanding performance despite underperforming the broader index approximately a quarter of the time since 1999, including material underperformance in 1999 (hence the analogy to today). That is our opportunity and why we focus on accurately predicting this group of companies and investing in them based on their strong business characteristics and quality factors.
While periods of underperformance are challenging, they often create opportunities for patient investors who remain disciplined and grounded in their investment approach. We think the current period of underperformance suggests upcoming tailwinds for equal weight and dividend growth strategies given the historic outperformance of each over time, especially after periods of underperformance. We think sticking to a consistent evidence-based approach is the right course of action.
Our research continues to point to strong fundamentals within our portfolio companies, many of which are trading at attractive valuations. At year end, our portfolio was trading at a 3.2% free cash flow yield, a discount compared to the S&P 500 at 2.8%. These are businesses with competitive advantages, healthy balance sheets, and a commitment to rewarding shareholders through a rapidly growing dividend, underlined by the fact our portfolio companies grew their dividends by ~15% over the last twelve months, compared to ~6% for the S&P 500 Index.
As market conditions evolve, we expect a broader rotation out of the companies that have led the market thus far and will ultimately validate our focus on high dividend growth stocks.
4th Quarter 2024 Commentary
US Equity Strategy
Portfolio Results
The US Equity strategy underperformed the S&P 500 Index during Q4 and over the full year. Approximately half the relative drag on the year occurred in the fourth quarter alone and only six of our 22 holdings posted positive returns in Q4. Our relative performance against the Index should be viewed in the context of a very narrow market as discussed earlier and an environment within the dividend universe that saw higher yielding stocks do better than our focus universe of high dividend growers.
Portfolio Dividend Growth – Trailing and consensus forward 12 months.
Note: Last 12 months (“LTM”) Dividend Growth is the median of the actual trailing 12-month dividend growth of the individual stocks held by Strategies or Index constituents as reported by Bloomberg as at Dec 31, 2024. Forward 12 months (“FTM”) Dividend Growth is the median of the Bristol Gate Model’s forward 12-month prediction for the individual stocks held by the Strategies and the median of consensus estimates for the constituents of the Indices as of quarter end. Companies without a consensus dividend forecast were excluded.
Source: Bloomberg, FactSet, Bristol Gate Capital Partners.
Contributors
No exposure to Consumer Staples, Real Estate, and Energy contributed positively to relative returns in the quarter.
On an absolute basis, Broadcom, McKesson, and Visa were amongst our best performers during the quarter.
Broadcom has been one of our best performing stocks throughout the year and had another strong quarter, rising almost 30% following their quarterly results in mid December. The company highlighted a $60-90 billion serviceable market by FY27 for AI related businesses (custom chip development and networking), driven by three existing hyperscaler customers with potential upside from an additional two more hyperscale customers the company is currently working with. This was well ahead of market expectations. We had viewed the opportunity for Broadcom’s AI business as underappreciated by the market and believed “Nvidia’s sales today are Broadcom’s opportunity tomorrow.” As these hyperscalers move from general purpose GPUs to Broadcom’s custom developed ASICs chips for certain applications to attain better performance per power input, Broadcom stands to benefit. If our view of how the hyperscaler data centre develops is correct, we believe Broadcom’s forecast of a $60-90 billion serviceable market by FY27 will prove to be conservative.
McKesson outperformed this quarter after being one of our largest detractors in the prior quarter. The company posted strong quarterly results on higher prescription volumes in the US Pharmaceutical segment and demonstrated growth in their specialty products and generic segments. We continue to believe the company is attractively valued and that underlying trends in its drug distribution business (aging population), continued capital allocation in its oncology franchise and broader adoption of its Prescription Technology Solutions will support management’s 12-14% EPS long-term CAGR target.
Entering the quarter, sentiment around Visa was poor due to the US Department of Justice filing a civil antitrust lawsuit against the company in September for monopolization & unlawful conduct in debit network markets. This isn’t the first time Visa (or Mastercard) has faced regulatory challenges, nor do we expect it to be the last time. Each time the companies have faced such hurdles, they have recovered due to the significant opportunity that remains in digitizing consumer and business payment flows. This was once again on display when Visa reported quarterly results delivering double-digit year-over-year revenue growth on the back of strong volume in payments. The company also announced a 13% increase in their dividend and a $7 billion share buyback authorization, indicating management’s confidence in the outlook going forward.
Over the full year, having no exposure to Energy, Consumer Staples, and Utilities contributed positively to relative returns. Broadcom, Carrier and Cintas were the largest contributors to absolute returns for the year.
Detractors
Stock selection in the Industrials, Consumer Discretionary, and Information Technology sectors detracted from returns in the period. Additionally, being overweight in Industrials and underweight in Consumer Discretionary and Information Technology further negatively impacted performance.
On an absolute basis, Microchip Technology, Applied Materials, and Zoetis were our weakest performers in the period.
Microchip continues to face revenue pressures due to the destocking cycle that has lasted longer and been deeper than expected. In December, the company reduced its quarterly revenue outlook and announced additional restructuring plans in light of the demand weakness. While we don’t know when the destocking cycle will end, we do know that it eventually will. With recent year over year revenue declines exceeding those experienced during COVID, the global financial crisis and the 2001 recession, we believe the stage is being set for a strong recovery in volumes when demand does return. We continue to monitor the company’s performance closely.
Despite reporting Q4 results that were ahead of consensus estimates, Applied Materials’ stock struggled on a weaker than expected revenue outlook. The company also didn’t offer much colour beyond Q1/25 with respect to growth in the wafer fab equipment market and the impact of export controls on Chinese demand. The lack of visibility was enough to overshadow positive near and long term trends such as continued strength in leading edge logic and gate all around architectures, advanced packaging, high bandwidth memory, integrated systems and a growing service mix. We believe the company remains very well positioned to capitalize on the need for energy-efficient computing driving growth and innovation in the semiconductor industry.
Zoetis lagged despite posting strong quarterly results due to negative headlines surrounding their new osteoarthritis (OA) drug launched in the US, Librela. The FDA’s Center for Veterinary Medicine notified veterinarians about reported adverse events for Librela via a “Dear Veterinarian Letter”. No other action was prescribed and the FDA reiterated that it determined Librela to be safe and effective for its intended use for control of pain associated with osteoarthritis in dogs. However, the FDA is recommending an updated label to include a section on “Post Approval Experience” that buckets adverse events into neurological, general, renal/urinary, gastrointestinal, and musculoskeletal events. We view the Dear Veterinarian Letter as a marginal negative for Zoetis as the US launch of Librela has been one of the key focuses for investors. At a recent investor event in November, the company said that they have treated nearly 1 million dogs in the US with Librela, implying 0.36% rate of reported adverse events, not high enough in our opinion to materially impact demand. In addition, we understand that some of FDA’s recommended label changes are already included on labels outside the US and will likely be incorporated in the US going forward. Although the stock has struggled this year, we continue to have a positive outlook on Zoetis’ long-term fundamentals, driven by the ongoing trend of the humanization of pets, higher animal proteins in diets as emerging market consumers grow wealthier, and the company’s innovation pipeline.
For the full year, in addition to not owning six of the “Magnificent 7” stocks, stock selection in the Information Technology and Industrials sectors detracted from returns. Additionally, the overweight allocation in the Health Care sector also negatively impacted performance. Microchip, Zoetis and American Tower (sold in the first quarter) were among our largest detractors.
Although it wasn’t one of the largest detractors for the quarter or year, we also want to address UnitedHealth (UNH) due to the tragic event on December 5th, when Brian Thompson, CEO of UnitedHealthcare’s Insurance segment, was killed in a targeted attack outside the UNH Investor Day event in New York City. Our thoughts and deepest condolences go out to Mr. Thompson’s family, friends, and colleagues during this incredibly difficult time.
As portfolio managers, it is necessary to evaluate events like this from an investment perspective, even amidst their profound personal impact. From that standpoint, UNH’s stock fell 17% from the day of the event to year end. The company has had its fair share of challenges this year: rising medical costs, higher healthcare utilization, and a more difficult regulatory environment were all top of mind for investors heading into the conference.
The biggest change following the events of December 5th was the negative sentiment and media attention the company received, including inaccurate or incomplete reporting across established news agencies and social media regarding denied insurance claims. We believe this is one of the main reasons for the stock’s decline during the month. Contrary to the widely circulated reports, UNH confirmed that less than 1% of all claims are reviewed due to medical or clinical reasons, a tiny fraction of rates reported in the media.
Before the Investor Day event was understandably cut short, UNH shared a 2025 outlook that aligned largely with consensus expectations. A slightly improved revenue forecast was balanced by higher anticipated medical costs, while the company reaffirmed its long-term EPS growth targets of 13-16%, supported by its robust position in the growing trend toward value-based care. With its integrated capabilities in care delivery, data, and technology, we believe UNH remains well-positioned to achieve sustainable growth and lower healthcare costs while improving outcomes. It has a strong and capable leadership team, and we are confident in the company’s ability to navigate these turbulent times without disruption to its strategic direction.
Transactions
As per our quarterly rebalancing process, we trimmed our position in Carrier Global. The proceeds were reallocated to Microchip Technology and Applied Materials.
Subsequent to quarter end, we made two changes to the portfolio selling CSX Corp and Corteva Inc. and buying Westinghouse Air Brake Technology Corp. and Eli Lilly and Co. in their place. We will have more on those transactions in next quarter’s letter.
Source: Bristol Gate Capital Partners. There is a risk of loss inherent in any investment; past performance is not indicative of future results. Please see important disclosures at end of document.
Canadian Equity Strategy
Market Recap
The S&P/TSX Composite Index returned ~22%, keeping pace with the S&P 500 Index despite not having the technology stocks that drove the majority of the returns for the US index.
The Bank of Canada responded to the lack of growth in the Canadian economy with five rate cuts during the year. After two years of underperforming the index, the Financials sector had a strong year and, given its large weight in the TSX, played a large part in the broad market’s gains for the year. Additionally, it was a strong year for the commodity sectors as both Energy and Materials returned over 20%, and the Technology sector’s gains were paced by Shopify which rose by almost 50% during the year.
Portfolio Results
The Canadian Equity strategy underperformed the benchmark in both the quarter and during 2024.
Our strategy looks different than the Canadian index – we had no exposure to Shopify or the Energy sector and were underweight the Financials sector (we added our only exposure to banks in Q4 with our investment in EQB Inc.). In the highly cyclical Canadian market, short-term noise can often drown out strong fundamentals. Despite a challenging year for our performance relative to the S&P/TSX Composite, we remain focused on our process that has delivered attractive long-term results.
The strategy’s returns benefited from strong selection in Consumer Staples (Dollarama) and Industrials, where Element Fleet, Waste Connections and Thomson Reuters all helped. The performance of our positions in the financial sector (Brookfield Corp, TMX, Intact and EQB from October) also helped drive strategy returns. We think these returns demonstrate our ability to find great companies beyond traditional portfolio holdings like the big 6 banks.
The sound fundamentals of our portfolio companies give us confidence that better days await. Our holdings in aggregate grew their dividends by over 13% over the last twelve months, as compared to just 5% for the S&P/TSX Composite. The dividend growth of our portfolio companies was on the back of results of median ~9% sales growth and ~4% earnings growth versus ~5% and ~0.5% for the broad market, respectively.
As we continue to navigate a trying period for the Canadian economy, we continue to believe our differentiated offering of a concentrated portfolio of high quality, high dividend growth businesses will benefit investors going forward.
Portfolio Dividend Growth – Trailing and consensus forward 12 months.
Note: Last 12 months (“LTM”) Dividend Growth is the median of the actual trailing 12-month dividend growth of the individual stocks held by Strategies or Index constituents as reported by Bloomberg as at Dec 31, 2024. Forward 12 months (“FTM”) Dividend Growth is the median of the Bristol Gate Model’s forward 12-month prediction for the individual stocks held by the Strategies and the median of consensus estimates for the constituents of the Indices as of quarter end. Companies without a consensus dividend forecast were excluded.
Source: Bloomberg, FactSet, Bristol Gate Capital Partners.
Contributors
An underweight position in Communication Services, along with no exposure to Utilities, contributed positively to returns during the period.
On an absolute basis, Broadcom, Brookfield Corp., and TFI International were amongst our best performers in the period.
Broadcom experience strong stock performance as the market continues to develop a better appreciation of the enormous opportunity and runway for growth the company has in developing custom chips and the levels of demand that exist.
Brookfield Corporation outperformed on record financial results, achieving an almost 20% increase year-over-year in distributable earnings. Strong growth alongside successful fundraising efforts and strategic acquisitions contributed to robust cash flows, positioning the company favorably in the market.
TFI outperformance was driven by resilient quarterly results, including growing revenues driven by strong logistics performance and strategic acquisitions. Additionally, growth in free cash flow enhanced debt reduction efforts, positioning the company favorably amidst a challenging market in terms of volumes.
For the year, stock selection in the Consumer Discretionary sector and Industrials, as well as an overweight to Communication Services, contributed to returns.
Detractors
Stock selection in the Information Technology, Health Care, and Financials sectors detracted from returns in the period. Additionally, the underweight position in the Financials sector also negatively impacted performance.
On an absolute basis, Stella-Jones, Enghouse Systems, and Premium Brands Holdings were amongst our weakest performers in the period.
Stella-Jones underperformed despite a significant year-over-year net income rise on market concerns about inventory levels and slower growth in key segments, which we believe are short-term in nature and remain confident in the long-term fundamentals of the business.
Enghouse trailed the market on results that did not meet market expectations on top line revenue. We believe discerning investors will see through the noise that the company’s acquisitions have on their reported results. The company’s SaaS segment continues to grow, and recurring revenues now make up over 70%. The company has ample cash on hand and continues to seek out strategic acquisitions and expects to continue to grow the dividend.
Premium Brands lagged as management revised their outlook downwards primarily given the weakness in sales at Starbucks, which represents a meaningful portion of revenues. We continue to monitor the company’s long-term growth prospects against our original investment thesis.
For the full year, stock selection in the Consumer Staples and Health Care sectors detracted from returns in the period. More impactful was stock selection in the Technology sector, as the two software consolidators that we own (Enghouse Systems and Open Text Corp.) had a challenging year both operationally and from a returns standpoint. Ongoing transition to SaaS and efforts to stay relevant in an AI-led world had both companies struggling to find traction with investors. We continue to monitor the situation in both names and at current valuations we are optimistic about the future.
Transactions
During the quarter, we exited our investments in InterRent REIT and Telus Corp. We initiated new investments in TFI International and EQB Inc.
TFI is a leading logistics company with exposure in the Less-Than-Truckload (LTL) and Truckload industry. The company has been a savvy operator and value creating capital allocator through M&A and organic re-investment. A track of record of strong dividend growth accompanied by a recovery in North American freight volumes and pricing underpin a strong management team and high-quality business.
EQB is a leading alternative financial lender targeting high quality borrowers that are not served by the big six. With the tailwind of a growing domestic population the company has a strong track record of prudent underwriting, and a history of attractive shareholder returns in addition to leading dividend growth.
In addition, as per our quarterly rebalancing process, we trimmed our positions in Brookfield Corp. and Colliers International Group and increased our investments in Alimentation Couche-Tard, Enghouse Systems Ltd. and Canadian National Railway Co.
Source: Bristol Gate Capital Partners. There is a risk of loss inherent in any investment; past performance is not indicative of future results. Please see important disclosures at end of document.
Firm Update
To all our clients:
Our business progress has continued to advance despite headwinds facing active investment managers, as discussed previously. Our US Equity strategy is now available on some of the largest North American distribution platforms, and we continue to see interest in this regard. Our success is due to the fact that our investment approach is recognized as being very differentiated and complementary to other dividend, value and growth managers. In short, we are a good fit for clients’ investment needs.
We remain committed to delivering long-term value and appreciate your patience as we navigate this period of market divergence. Should you have any questions or wish to discuss our strategy further, please do not hesitate to reach out.
Wishing you a prosperous and healthy year ahead,
The Bristol Gate Team
Important disclosures
There is a risk of loss inherent in any investment; past performance is not indicative of future results. Prospective and existing investors in Bristol Gate’s pooled funds or ETF funds should refer to the fund’s offering documents which outline the risk factors associated with a decision to invest. Separately managed account clients should refer to disclosure documents provided which outline risks of investing. Pursuant to SEC regulations, a description of risks associated with Bristol Gate’s strategies is also contained in Bristol Gate’s Form ADV Part 2A located at www.bristolgate.com/regulatory-documents.
The information contained herein is obtained from multiple sources that are believed to be reliable. However, such information may not have been verified, and may be different from the information included in documents and materials created by a sponsor firm in whose investment program a client participates. Some sponsor firms may require that these Bristol Gate materials are preceded or accompanied by investment profiles or other documents or materials prepared by such sponsor firms, which will be provided upon a client’s request. There may be discrepancies between Bristol Gate’s performance returns and the returns included in a sponsor firm’s profile document (for example, but not limited to, differences in account size/type, portfolio management strategies, the number of securities held, average account size, inclusion of institutional or mutual fund accounts, etc.) For additional information, documents and/or materials, please speak to your Financial Advisor.
US Equity Strategy returns in this report refer to the Bristol Gate US Equity Strategy Composite (the “US Composite”). The US Composite consists of equities of publicly traded, dividend paying US companies. The US Composite is valued in US Dollars and for comparison purposes is measured against the S&P 500 Total Return Index. The US Composite’s Investment Advisor, Bristol Gate Capital Partners Inc., defines itself as a portfolio manager, exempt market dealer and investment fund manager (as per its registration in Ontario, its principal regulator in Canada) and is also a Registered Investment Adviser with the U.S. Securities and Exchange Commission (the “SEC”). The Investment Advisor’s objective is to select companies with positive dividend growth, and which collectively will generate over the long term a growing income and capital appreciation for investors. The inception date of the US Composite is May 15, 2009. The US Dollar is the currency used to measure performance, which is presented on a gross and net basis and includes the reinvestment of investment income. The US Composite’s gross return is gross of withholding tax prior to January 1, 2017 and is net of withholding tax thereafter. Net returns are calculated by reducing the gross returns by the maximum management fee charged by Bristol Gate of 1%, applied monthly. Actual investment advisory fees incurred by clients may vary. There is the opportunity for the use of leverage up to 30% of the net asset value of the underlying investments using a margin account at the prime broker. Thus far no material leverage has been utilized. An investor’s actual returns may be reduced by management fees, performance fees, and other operating expenses that may be incurred because of the management of the US Composite. A performance fee may also be charged on some accounts and funds managed by the firm. Bristol Gate claims compliance with the Global Investment Performance Standards (GIPS®). GIPS® is a registered trademark of CFA Institute. CFA Institute does not endorse or promote this organization, nor does it warrant the accuracy or quality of the content contained herein. To obtain a GIPS Composite Report, please email us at info@bristolgate.com.
The S&P 500® Total Return Index measures the performance of the broad US equity market, including dividend re-investment, in US dollars. This index is provided for information only and comparisons to the index has limitations. The benchmark is an appropriate standard against which the performance of the strategy can be measured over longer time periods as it represents the primary investment universe from which Bristol Gate selects securities. However, Bristol Gate’s portfolio construction process differs materially from that of the benchmark and the securities selected for inclusion in the strategy are not influenced by the composition of the benchmark. For example, the strategy is a concentrated portfolio of approximately equally weighted dividend-paying equity securities, rebalanced quarterly whereas the benchmark is a broad stock index (including both dividend and non-dividend paying equities) that is market capitalization weighted. As such, strategy performance deviations relative to the benchmark may be significant, particularly over shorter time periods. The strategy has concentrated investments in a limited number of companies; as a result, a change in one security’s value may have a more significant effect on the strategy’s value.
In addition to the US Equity strategy’s benchmark described above, the following additional Index data may be presented for information purposes only and comparisons to these Indices has limitations:
The S&P 500® Equal Weight Index (EWI) is the equal-weight version of the widely-used S&P 500. The index includes the same constituents as the capitalization weighted S&P 500, but each company in the S&P 500 EWI is allocated a fixed weight – or 0.2% of the index total at each quarterly rebalance. The index is used to highlight the impact of concentration in the market cap weighted index but it does not solely focus on dividend paying securities, whereas Bristol Gate’s US Equity strategy’s securities are selected based on future dividend growth.
S&P 500 ® Total Return Dividend Aristocrats Index measures the performance of a subset of S&P 500® Index companies that have increased their dividends every year for the last 25 consecutive years. This Index focuses on historical dividend growth, whereas Bristol Gate’s US Equity strategy’s securities are selected based on future dividend growth.
SPDR® S&P 500® ETF Trust (SPY US) sourced from Bloomberg has been used as a proxy for the S&P 500® Total Return Index for the purpose of providing non-return-based portfolio statistics and sector weightings in this report. SPY US is an ETF that seeks to provide investment results that, before expenses, correspond generally to the price and yield performance of the S&P 500® Index.
Canadian Equity Strategy returns in this report refer to the Bristol Gate Canadian Equity Strategy Composite (the “Canadian Composite”). The Canadian Composite consists primarily of equities of publicly traded, dividend paying Canadian companies. The Canadian Composite is valued in Canadian Dollars and for comparison purposes is measured against the S&P/TSX. The Canadian Composite’s Investment Advisor, Bristol Gate Capital Partners Inc., defines itself as a portfolio manager, exempt market dealer and investment fund manager (as per its registration in Ontario, its principal regulator in Canada) and is also a Registered Investment Adviser with the U.S. Securities and Exchange Commission (the “SEC”). The Investment Advisor’s objective is to select companies primarily from the S&P/TSX universe with positive dividend growth and which collectively will generate over the long term a growing income and capital appreciation for investors. The inception date of the Canadian Composite is July 1, 2013. Returns are presented gross and net of fees and include the reinvestment of all income. The Canadian composite’s gross return is gross of withholding tax prior to January 1, 2017 and is net of withholding tax thereafter. Net returns are calculated by reducing the gross returns by the maximum management fee charged by Bristol Gate of 0.7%, applied monthly. Actual investment advisory fees incurred by clients may vary. An investor’s actual returns may be reduced by management fees, performance fees, and other operating expenses that may be incurred because of the management of the Canadian Composite. A performance fee may be charged on some accounts and funds managed by the firm. Bristol Gate claims compliance with the Global Investment Performance Standards (GIPS®). GIPS® is a registered trademark of CFA Institute. CFA Institute does not endorse or promote this organization, nor does it warrant the accuracy or quality of the content contained herein. To obtain a GIPS Composite Report, please email us at info@bristolgate.com.
The returns have been converted into Canadian Dollars using the prevailing Canadian/United States dollar exchange rate.
The S&P/TSX Total Return Index measures the performance of the broad Canadian equity market, including dividend re-investment, in Canadian dollars. This index has been provided for information only and comparisons to the index has limitations. The benchmark is an appropriate standard against which the performance of the strategy can be measured over longer time periods as it represents the primary investment universe from which Bristol Gate selects securities. However, Bristol Gate’s portfolio construction process differs materially from that of the benchmark and the securities selected for inclusion in the strategy are not influenced by the composition of the benchmark. For example, the strategy is a concentrated portfolio of approximately equally weighted dividend-paying equity securities, rebalanced quarterly whereas the benchmark is a broad stock index (including both dividend and non-dividend paying equities) that is market capitalization weighted. As such, strategy performance deviations relative to the benchmark may be significant, particularly over shorter time periods. The strategy has concentrated investments in a limited number of companies; as a result, a change in one security’s value may have a more significant effect on the strategy’s value.
iShares Core S&P®/TSX® Capped Composite Index ETF (XIC CN) sourced from Bloomberg has been used as a proxy for the S&P®/TSX® Total Return Index for the purpose of providing non-return-based portfolio statistics and sector weightings in this report. XIC CN is an ETF that seeks long-term capital growth by replicating the performance of the S&P®/TSX® Capped Composite Index, net of expenses.
This Report is for information purposes and should not be construed under any circumstances as a public offering of securities in any jurisdiction in which an offer or solicitation is not authorized. Prospective investors in Bristol Gate’s pooled funds or ETF funds should rely solely on the fund’s offering documents, which outline the risk factors associated with a decision to invest. No representations or warranties of any kind are intended or should be inferred with respect to the economic return or the tax implications of any investment in a Bristol Gate fund.
This piece is presented for illustrative and discussion purposes only. It should not be considered as personal investment advice or an offer or solicitation to buy and/or sell securities and it does not consider unique objectives, constraints, or financial needs of the individual. Under no circumstances does this piece suggest that you should time the market in any way or make investment decisions based on the content. Investors are advised that their investments are not guaranteed, their values change frequently, and past performance may not be repeated. References to specific securities are presented to illustrate the application of our investment philosophy only, do not represent all of the securities purchased, sold or recommended for the portfolio, and it should not be assumed that investments in the securities identified were or will be profitable and should not be considered recommendations by Bristol Gate Capital Partners Inc. A full list of security holdings is available upon request. For more information contact Bristol Gate Capital Partners Inc. directly. The information contained in this piece is the opinion of Bristol Gate Capital Partners Inc. and/or its employees as of the date of the piece and is subject to change without notice. Every effort has been made to ensure accuracy in this piece at the time of publication; however, accuracy cannot be guaranteed. Market conditions may change and Bristol Gate Capital Partners Inc. accepts no responsibility for individual investment decisions arising from the use of or reliance on the information contained herein. We strongly recommend you consult with a financial advisor prior to making any investment decisions. Please refer to the Legal section of Bristol Gate’s website for additional information at bristolgate.com.
A Note About Forward-Looking Statements
This report may contain forward-looking statements including, but not limited to, statements about the Bristol Gate strategies, risks, expected performance and condition. Forward-looking statements include statements that are predictive in nature, that depend upon or refer to future events and conditions or include words such as “may”, “could”, “would”, “should”, “expect”, “anticipate”, “intend”, “plan”, “believe”, “estimate” and similar forward-looking expressions or negative versions thereof.
These forward-looking statements are subject to various risks, uncertainties and assumptions about the investment strategies, capital markets and economic factors, which could cause actual financial performance and expectations to differ materially from the anticipated performance or other expectations expressed. Economic factors include, but are not limited to, general economic, political and market factors in North America and internationally, interest and foreign exchange rates, global equity and capital markets, business competition, technological change, changes in government regulations, unexpected judicial or regulatory proceedings, and catastrophic events.
Readers are cautioned not to place undue reliance on forward-looking statements and consider the above-mentioned factors and other factors carefully before making any investment decisions. All opinions contained in forward-looking statements are subject to change without notice and are provided in good faith. Forward-looking statements are not guarantees of future performance, and actual results could differ materially from those expressed or implied in any forward-looking statements. Bristol Gate Capital Partners Inc. has no specific intention of updating any forward-looking statements whether as a result of new information, future events or otherwise, except as required by securities legislation.