
July 21, 2025
US Equity Strategy Results
The Bristol Gate U.S. Equity Strategy underperformed the S&P 500 Total Return Index during Q2 as uncertainty reigned as US trade tariffs were announced resulting in a decline early in the quarter and later suspended leading to a strong snap back for the index. On top of the “Liberation Day” narrative, the “One, Big, Beautiful Bill” sought to extend tax cuts passed in 2017, combined with increased defence spending, and cutbacks on programmes like Medicaid.
Diversification was not rewarded in the quarter with three sectors, Information Technology, Communication Services and Consumer Discretionary, contributing ~90% of the S&P 500’s return in Q2. After a slow start to the year, Meta, Nvidia and Microsoft accounted for ~50% of the index’s year to date return. Apple was the only member of the Magnificent 7 posting a negative return in the quarter. Real Estate, Health Care and Energy were the laggards. Health Care faced increased scrutiny as the Trump administration seeks to lower drug prices.
The Bristol Gate US Equity Strategy performed in-line with expectations year-to-date. In Q1, the strategy added value in a declining market.
Exhibit 1:
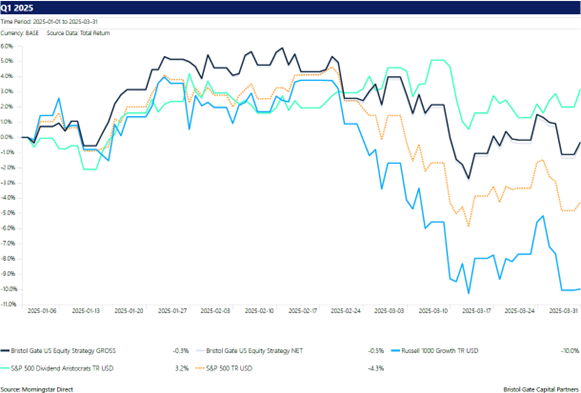
Source: Bristol Gate Capital Partners, Bloomberg. Bristol Gate US Equity Strategy returns per the chart above belong to a representative account in the Bristol Gate US Equity Strategy Composite as a proxy to demonstrate daily returns on a gross basis and net basis (net of a 1% management fee). There is a risk of loss inherent in any investment; past performance is not indicative of future results. Please refer to full performance history of the Bristol Gate US Equity Strategy Composite within this letter. Please see important disclosures at end of document.
Q2 saw impressive returns for the S&P 500 and further upside from the Russell 1000 Growth as tech stocks continue their torrid run based on AI enthusiasm, cloud computing, internet of things and the subsequent earnings growth. While Bristol Gate lagged the two mentioned indices, we outpaced the S&P 500 Dividend Aristocrats, which generally has been the case in strong equity markets.
Exhibit 2:
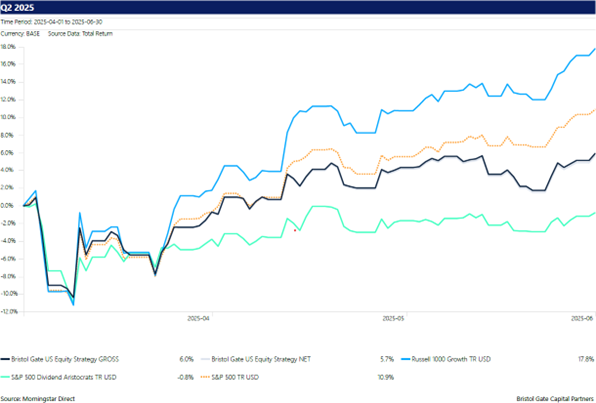
Source: Bristol Gate Capital Partners, Bloomberg. Bristol Gate US Equity Strategy returns per the chart above belong to a representative account in the Bristol Gate US Equity Strategy Composite as a proxy to demonstrate daily returns on a gross basis and net basis (net of a 1% management fee). There is a risk of loss inherent in any investment; past performance is not indicative of future results. Please refer to full performance history of the Bristol Gate US Equity Strategy Composite within this letter. Please see important disclosures at end of document.
Through the first half of 2025, our strategy is in-line with expectations in context of the S&P 500 and Russell 1000 Growth, while outperforming the S&P 500 Dividend Aristocrats.
Exhibit 3:

Source: Bristol Gate Capital Partners, Bloomberg. Bristol Gate US Equity Strategy returns per the chart above belong to a representative account in the Bristol Gate US Equity Strategy Composite as a proxy to demonstrate daily returns on a gross basis and net basis (net of a 1% management fee). There is a risk of loss inherent in any investment; past performance is not indicative of future results. Please refer to full performance history of the Bristol Gate US Equity Strategy Composite within this letter. Please see important disclosures at end of document.
In Q2, previous narratives returned with mega-cap tech names, retail “buy the dip” investors and narrow breadth leading the market higher. The S&P 500 and Nasdaq 100 ended the quarter at new all-time highs. Growth and Momentum led factor returns, while Quality, Low Volatility and Dividend Yield were amongst the worst performing factors.
The US Dollar declined 10.7% in the first half of 2025, marking the worst first half since 1973, when President Richard Nixon broke the Bretton Woods gold standard. The dollar will continue to be a focal point as the year goes on.
Key Contributors
Positive relative sector allocation from Industrials and an underweight to Consumer Staples and Energy aided returns in the quarter. From an absolute return perspective, Information Technology, Industrials, and Financials drove returns.
Leading contributors included Broadcom, GE Aerospace and McKesson.
Broadcom’s strong returns in Q2 were driven by demand for AI networking and custom accelerators, combined with synergies integrating VMware’s infrastructure software. We continue to believe the company has a significant opportunity ahead of it with its custom semiconductor chip business as hyperscalers look for efficient computing solutions to lower the cost of their massive datacenter investments.
GE Aerospace’s performance was primarily helped by robust demand in commercial aviation services and new engine orders, supported by efficient operations, strategic investments in manufacturing and disciplined financial management which aided profitability and cash flow.
Healthcare services company McKesson benefitted from its core US pharmaceutical distribution businesses in speciality and high growth areas like GLP-1 medication. It also demonstrated strategic portfolio management through the acquisition of PRISM Vision Holdings, and the divestiture of its Canadian retail businesses (Rexall and Well.ca) while continuing to focus on efficiency and cost control.
Key Detractors
Health Care, Financials and Consumer Discretionary hurt relative returns in the quarter.
UnitedHealth Group, Thermo Fisher and Marsh & McLennan were the main detractors from absolute performance.
UnitedHealth fell after suspending its 2025 financial outlook and announcing the departure of CEO Andrew Witty in May. UnitedHealth has struggled with several issues over the last year, most notably higher than anticipated medical costs impacting profitability in its health insurance and OptumHealth segments. Given the nature of health insurance contracts (renewed annually) we believe the company will adjust pricing, benefits, premiums, and co-pays in the upcoming cycle to account for the current cost environment and as such expect profitability to improve going into 2026. Commentary from key competitors has also been consistent with such actions.
Thermo Fisher was impacted by an increase in regulatory and policy risk related to the healthcare sector. In May, President Trump issued an Executive Order aimed at reducing the cost of prescription drugs by directing federal agencies to link US prices to the lower prices paid for the same drugs in a group of other developed countries. This approach is referred to as “most favored nation” (MFN) pricing, however it is unclear how it will be implemented or which drugs will be affected. Nonetheless, the potential for lower profits at biotech and pharma companies led to R&D spending concerns for one of Thermo’s key customer segments. In addition, the threat of tariffs on pharmaceutical drugs and a reduction in federal funding for academic and government related research via the DOGE initiative weighed on the stock and the sector generally.
Marsh & McLennan declined during the quarter based on a modest revenue miss, diminishing insurance pricing and a dip in adjusted operating margin. This decline comes after an extended period of strong performance and despite beating earning per share expectations.
Portfolio Transactions
During the quarter, we initiated a position in Accenture by exiting our position in Microchip.
Accenture thrives on change, leveraging rapid technological advancements to drive consistent demand for its IT services. As the clear leader in the fragmented consulting market, Accenture’s strong brand, unmatched global scale, comprehensive service offerings, and deep client relationships position it to continually gain market share from smaller competitors. Financially, Accenture stands out with a compelling fundamental track record. Since launching a dividend in 2006, Accenture has had a history of consistently increasing it in the mid-teens.
With Microchip, a broad-based inventory destock has lasted longer and been deeper than we expected, negatively impacting the company’s operations and our dividend growth expectations. Recent tariff announcements have further increased uncertainty around the company’s future potential. The lowered dividend growth expectations plus the increased uncertainty led us to exit the stock after it rebounded from recent lows.
Outlook
The Bristol Gate US Equity strategy performed in-line with expectations year-to-date based on market dynamics (adding value in Q1 in a drawdown, lagging in Q2 in a strong growth market driven by narrow breadth). The second half of 2025 raises multiple questions regarding policy volatility, increasing debt and deficits, labour force strength, as well as potential interest rate cuts from the Federal Reserve. As the chart below shows, bond markets are betting on rate cuts while the equity market favours cyclicals over defensives.
Exhibit 4:
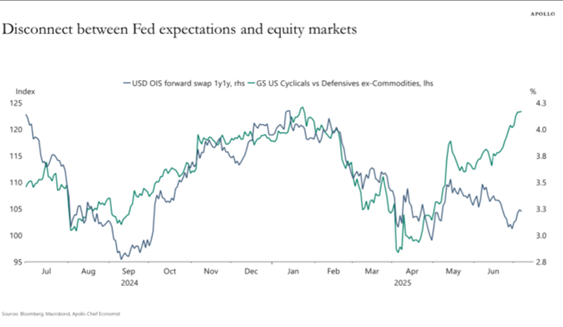
Chart: © Apollo Global Management
In this period of uncertainty, the range of outcomes seems to multiply every week. While we cannot control outcomes, let alone headline risk, we are focused on ensuring the businesses we own are able to grow despite this volatility. As we said after the first quarter, our holdings include industry-leading firms characterized by solid market positions, strong balance sheets, consistent generation of substantial free cash flows, and proven resilience through past economic downturns.
Our portfolio continues to outpace the S&P 500 in positive earnings revisions versus the prior 3-month (59% vs 44%) and 6-month (64% vs 37%) time periods, illustrating the conviction of management guidance and the ability to grow earnings in an unpredictable environment.
The second quarter demonstrated how investor appetite for the AI trade has not been satisfied. While we see the merits of riding the dominant themes in the market, especially at times of uncertainty, we are committed to finding quality companies with rising dividends, knowing they will continue to serve investors well no matter the theme of the moment.
Given the portfolio companies’ robust financial health, we anticipate continually increasing dividend payouts in H2 2025, providing our investors with reliable and growing income streams, even amid market turbulence. We will look to take advantage of market volatility, and upgrade the quality if opportunities arise.
In closing, Bristol Gate believes our portfolio offers a basket of attractive companies that can benefit and navigate economic uncertainty.

Source: Bristol Gate Capital Partners. There is a risk of loss inherent in any investment; past performance is not indicative of future results. Please see important disclosures at end of document.
Canadian Equity Strategy Results
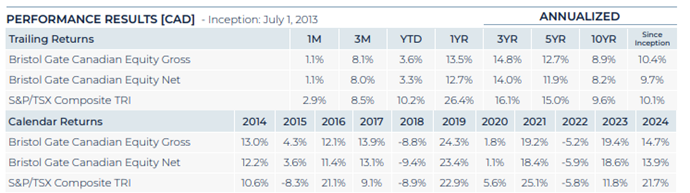
The Bristol Gate Canadian Equity Strategy modestly lagged the S&P/TSX Composite TR Index in Q2. Uncertainty reigned as US trade tariffs were announced and later suspended leading to a strong snap back. On top of the “Liberation Day” narrative, the “One, Big, Beautiful Bill” sought to extend tax cuts passed in 2017, combined with increased defence spending, and cutbacks on programmes like Medicaid.
In April, Canada’s trade deficit widened to a record $7.14 billion while Canadian exports dropped by 10.8% overall. The Canadian economy grew by 2.2% in Q1, front loading orders from Canada prior to tariffs. Prime Minister Mark Carney focused on transforming Canada’s economy, removing provincial trade barriers and developing key energy projects.
The Canadian dollar continued its appreciation since the end of last year, rising ~4.8% versus the US dollar in Q2.
Information Technology, Consumer Discretionary and Financials were the top 3 sectors during the quarter. In fact, all GICS sectors were positive, illustrating the depth and upward directionality generally for Canadian equities.
Key Contributors
Broadcom, Jamieson Wellness, and Element Fleet Management, were amongst the largest absolute contributors. An underweight to Energy, Communication Services and stock selection in Materials also aided relative performance.
Broadcom’s strong returns in Q2 were driven by demand for AI networking and custom accelerators, combined with synergies integrating VMware’s infrastructure software. We continue to believe the company has a significant opportunity ahead of it with its custom semiconductor chip business as hyperscalers look for efficient computing solutions to lower the cost of their massive datacenter investments.
Jamieson Wellness benefited from strong Q1 2025 earnings momentum during the quarter as growth in China, international expansion, innovation roadmap and new product launches expected in H2 2025 helped. Expansion in club and e-commerce channels in Canada, along with new distribution and e-commerce partnerships for the Youtheory brand in the US are expected to drive sales.
Element Fleet Management saw strong Q1 earnings on April 30, reporting solid net revenue growth as their capital light business model supported positive operating leverage. Return on Equity increased to 16.7% from 15.4% year-over-year. The company reported an order backlog of $2 billion, and affirmed their full-year guidance, reinforcing investor confidence. BMO and RBC Capital Markets increased price targets.
Key Detractors
Leading detractors included Waste Connections, Enghouse Systems, and Alimentation Couche-Tard. Stock selection and active weights in Financials, Industrials and Real Estate hurt relative returns.
While Waste Connections reported strong Q1 2025 earnings in late April, the stock was subdued during the rest of the quarter due to market rotation and a more risk-on environment. Investors rotated out of defensive and lower growth stocks into more growth-oriented sectors. Other factors hurting the stock price is its perceived premium valuation due to its consistent stable growth. It continues to trade at a premium to its peers, but consistent with its EV/EBITDA multiple over the past 5 years. The company’s fundamentals remain strong, but some analysts noted its valuation was “high” after the late April earnings release.
Enghouse Systems fell short of analyst expectations in Q2 earnings released earlier in June. The company missed on earnings and revenue forecasts, elevating negative sentiment. Net income decreased relative to the same period last year, EBITDA declined and operating cash flow decreased. Integration of the Margento and Trafi acquisitions haven’t been fully optimized and there’s been some challenges in monetizing AI. Despite the near-term challenges, Enghouse maintains a strong cash position with no external debt, has a long track record of increasing dividends and management expects a stronger second half of the year.
The primary factors on performance for Alimentation Couche-Tard (ATD) earlier in the quarter were analyst target price reductions and lack of positive developments in its bid for 7/11, followed by mixed earnings in late June. Q4 Fiscal 2025 earnings showed mixed results, with lower adjusted net earnings and revenue decline year-over-year with merchandise sales pressure in the US. Higher income tax rate and strategic investments hurt net earnings. Despite the challenges, ATD highlighted strong results in Canada and Europe in same-store merchandise sales, increased annual dividends, share repurchase programs, integration of the TotalEnergies assets in Europe and positive outlook from the majority of analysts.
Portfolio Transactions
During the quarter, we initiated a position in TerraVest by removing our position in Colliers.
TerraVest is a consolidator of manufacturing companies that sell goods and services to agriculture, mining, energy production and distribution, chemical, utilities, transportation and construction. Management have been excellent stewards of capital and demonstrated a disciplined approach to acquisitions, adding accretive businesses to their overall portfolio, while unlocking exceptional growth for shareholders over the past decade. The stock price returns reflect management’s execution, and we believe the current valuation justifies the growth and profitability going forward with the expectations of delivering double-digit dividend growth.
Colliers focus on M&A over dividend growth fell short of our expectations, resulting in removal from the portfolio. Despite executing its growth plan, diversifying from capital markets revenue volatility in asset management and engineering services, ultimately our process focuses on dividend growth first and foremost, and we have a higher conviction in TerraVest relative to Colliers going forward.
Additionally, we removed Broadcom and Zoetis from the portfolio this quarter. Bristol Gate Capital Partners continually evaluates and strives for efficacy in the optimization of our product suite to reflect client demands where applicable. Since the launch of the Bristol Gate Canadian Equity ETF in early 2018, the Bristol Gate Canadian Equity strategy has had limited US equity exposure, holding up to 2 US securities. Feedback from advisors and institutional clientele have emphasized a strong preference for a pure play building block in the Canadian high dividend growth equity bucket. This change provides allocators optimal flexibility in portfolio construction.
The Bristol Gate Canadian Equity Strategy delivers a high active share portfolio that doesn’t look like the index. We focus on maximizing long-term returns and diversifying our exposures across risk vectors, not sectors. After careful consideration of our portfolio and the Canadian high dividend growth universe, we’ve eliminated our US equity exposure as we focus on delivering a Canadian Equity portfolio in the high dividend growth space. The Bristol Gate Canadian Equity Strategy will now hold 20 names, an appropriate number of holdings to balance diversification and concentration in the high dividend growth universe.
Outlook
While US relations and trade policy should be ironed out in due time, other possible risks include tariff reversal, inflation and rising unemployment which has an inverse correlation on housing prices and vice-versa, impacting consumer confidence and sentiment. The S&P/TSX Composite TR outperformed the S&P 500 TR in the first half of the year but lagged in Q2 as the S&P 500 TR delivered a strong quarter. Canadian equities have benefitted from Growth tailwinds as well with Small Cap Growth, Mid-Cap Growth and Momentum leading the way during the quarter over other factors like Dividend, and Low Volatility.
Consumer sentiment has rebounded somewhat, however its yet to fully recover from a decline earlier this year. Housing markets are showing signs of stabilization, but sales are low. The Bank of Canada will likely resume cutting rates in the second half of the year as long as inflation remains predictable.

Source: Bristol Gate Capital Partners. There is a risk of loss inherent in any investment; past performance is not indicative of future results. Please see important disclosures at end of document.
Firm Update
We continue to build relationships in North America and beyond, which will provide future growth for our firm. Our focus on using artificial intelligence to enhance our investment process is increasingly valued and there continues to be demand for a unique, evidence-based investment approach that provides investors with additional income every year.
We are happy to announce that Clayton Kelly joined Bristol Gate in April as a Portfolio Specialist and Shalini Chirimunj joined us in May as an Operations Analyst. These additions will strengthen our ability to continue to serve our clients to the best of our abilities.
To all our clients, thank you for your ongoing support and trust. We are determined to do everything we can to provide you income growth and strong investment returns into the future.
Sincerely,
The Bristol Gate Team
Important disclosures
There is a risk of loss inherent in any investment; past performance is not indicative of future results. Prospective and existing investors in Bristol Gate’s pooled funds or ETF funds should refer to the fund’s offering documents which outline the risk factors associated with a decision to invest. Separately managed account clients should refer to disclosure documents provided which outline risks of investing. Pursuant to SEC regulations, a description of risks associated with Bristol Gate’s strategies is also contained in Bristol Gate’s Form ADV Part 2A located at www.bristolgate.com/regulatory-documents.
The information contained herein is obtained from multiple sources that are believed to be reliable. However, such information may not have been verified, and may be different from the information included in documents and materials created by a sponsor firm in whose investment program a client participates. Some sponsor firms may require that these Bristol Gate materials are preceded or accompanied by investment profiles or other documents or materials prepared by such sponsor firms, which will be provided upon a client’s request. There may be discrepancies between Bristol Gate’s performance returns and the returns included in a sponsor firm’s profile document (for example, but not limited to, differences in account size/type, portfolio management strategies, the number of securities held, average account size, inclusion of institutional or mutual fund accounts, etc.) For additional information, documents and/or materials, please speak to your Financial Advisor.
US Equity Strategy returns in this report refer to the Bristol Gate US Equity Strategy Composite (the “US Composite”). The US Composite consists of equities of publicly traded, dividend paying US companies. The US Composite is valued in US Dollars and for comparison purposes is measured against the S&P 500 Total Return Index. The US Composite’s Investment Advisor, Bristol Gate Capital Partners Inc., defines itself as a portfolio manager, exempt market dealer and investment fund manager (as per its registration in Ontario, its principal regulator in Canada) and is also a Registered Investment Adviser with the U.S. Securities and Exchange Commission (the “SEC”). The Investment Advisor’s objective is to select companies with positive dividend growth, and which collectively will generate over the long term a growing income and capital appreciation for investors. The inception date of the US Composite is May 15, 2009. The US Dollar is the currency used to measure performance, which is presented on a gross and net basis and includes the reinvestment of investment income. The US Composite’s gross return is gross of withholding tax prior to January 1, 2017 and is net of withholding tax thereafter. Net returns are calculated by reducing the gross returns by the maximum management fee charged by Bristol Gate of 1%, applied monthly. Actual investment advisory fees incurred by clients may vary. There is the opportunity for the use of leverage up to 30% of the net asset value of the underlying investments using a margin account at the prime broker. Thus far no material leverage has been utilized. An investor’s actual returns may be reduced by management fees, performance fees, and other operating expenses that may be incurred because of the management of the US Composite. A performance fee may also be charged on some accounts and funds managed by the firm. Bristol Gate claims compliance with the Global Investment Performance Standards (GIPS®). GIPS® is a registered trademark of CFA Institute. CFA Institute does not endorse or promote this organization, nor does it warrant the accuracy or quality of the content contained herein. To obtain a GIPS Composite Report, please email us at info@bristolgate.com.
The S&P 500® Total Return Index measures the performance of the broad US equity market, including dividend re-investment, in US dollars. This index is provided for information only and comparisons to the index has limitations. The benchmark is an appropriate standard against which the performance of the strategy can be measured over longer time periods as it represents the primary investment universe from which Bristol Gate selects securities. However, Bristol Gate’s portfolio construction process differs materially from that of the benchmark and the securities selected for inclusion in the strategy are not influenced by the composition of the benchmark. For example, the strategy is a concentrated portfolio of approximately equally weighted dividend-paying equity securities, rebalanced quarterly whereas the benchmark is a broad stock index (including both dividend and non-dividend paying equities) that is market capitalization weighted. As such, strategy performance deviations relative to the benchmark may be significant, particularly over shorter time periods. The strategy has concentrated investments in a limited number of companies; as a result, a change in one security’s value may have a more significant effect on the strategy’s value.
In addition to the US Equity strategy’s benchmark described above, the following additional Index data may be presented for information purposes only and comparisons to these Indices has limitations:
S&P 500 ® Total Return Dividend Aristocrats Index measures the performance of a subset of S&P 500® Index companies that have increased their dividends every year for the last 25 consecutive years. This Index focuses on historical dividend growth, whereas Bristol Gate’s US Equity strategy’s securities are selected based on future dividend growth.
The Russell 1000 Growth Total Return Index measures the performance of the large-cap growth segment of the US Equity universe. This Index may be used to contextualize the performance of the Bristol Gate US Equity strategy as it is a broadly utilized style index. However, this index does not solely focus on dividend paying securities, whereas Bristol Gate’s US Equity strategy’s securities solely are focused on dividend paying securities.
SPDR® S&P 500® ETF Trust (SPY US) sourced from Bloomberg has been used as a proxy for the S&P 500® Total Return Index for the purpose of providing non-return-based portfolio statistics and sector weightings in this report. SPY US is an ETF that seeks to provide investment results that, before expenses, correspond generally to the price and yield performance of the S&P 500® Index.
Canadian Equity Strategy returns in this report refer to the Bristol Gate Canadian Equity Strategy Composite (the “Canadian Composite”). The Canadian Composite consists primarily of equities of publicly traded, dividend paying Canadian companies. The Canadian Composite is valued in Canadian Dollars and for comparison purposes is measured against the S&P/TSX. The Canadian Composite’s Investment Advisor, Bristol Gate Capital Partners Inc., defines itself as a portfolio manager, exempt market dealer and investment fund manager (as per its registration in Ontario, its principal regulator in Canada) and is also a Registered Investment Adviser with the U.S. Securities and Exchange Commission (the “SEC”). The Investment Advisor’s objective is to select companies primarily from the S&P/TSX universe with positive dividend growth and which collectively will generate over the long term a growing income and capital appreciation for investors. The inception date of the Canadian Composite is July 1, 2013. Returns are presented gross and net of fees and include the reinvestment of all income. The Canadian composite’s gross return is gross of withholding tax prior to January 1, 2017 and is net of withholding tax thereafter. Net returns are calculated by reducing the gross returns by the maximum management fee charged by Bristol Gate of 0.7%, applied monthly. Actual investment advisory fees incurred by clients may vary. An investor’s actual returns may be reduced by management fees, performance fees, and other operating expenses that may be incurred because of the management of the Canadian Composite. A performance fee may be charged on some accounts and funds managed by the firm. Bristol Gate claims compliance with the Global Investment Performance Standards (GIPS®). GIPS® is a registered trademark of CFA Institute. CFA Institute does not endorse or promote this organization, nor does it warrant the accuracy or quality of the content contained herein. To obtain a GIPS Composite Report, please email us at info@bristolgate.com.
The returns have been converted into Canadian Dollars using the prevailing Canadian/United States dollar exchange rate.
The S&P/TSX Total Return Index measures the performance of the broad Canadian equity market, including dividend re-investment, in Canadian dollars. This index has been provided for information only and comparisons to the index has limitations. The benchmark is an appropriate standard against which the performance of the strategy can be measured over longer time periods as it represents the primary investment universe from which Bristol Gate selects securities. However, Bristol Gate’s portfolio construction process differs materially from that of the benchmark and the securities selected for inclusion in the strategy are not influenced by the composition of the benchmark. For example, the strategy is a concentrated portfolio of approximately equally weighted dividend-paying equity securities, rebalanced quarterly whereas the benchmark is a broad stock index (including both dividend and non-dividend paying equities) that is market capitalization weighted. As such, strategy performance deviations relative to the benchmark may be significant, particularly over shorter time periods. The strategy has concentrated investments in a limited number of companies; as a result, a change in one security’s value may have a more significant effect on the strategy’s value.
iShares Core S&P®/TSX® Capped Composite Index ETF (XIC CN) sourced from Bloomberg has been used as a proxy for the S&P®/TSX® Total Return Index for the purpose of providing non-return-based portfolio statistics and sector weightings in this report. XIC CN is an ETF that seeks long-term capital growth by replicating the performance of the S&P®/TSX® Capped Composite Index, net of expenses.
This Report is for information purposes and should not be construed under any circumstances as a public offering of securities in any jurisdiction in which an offer or solicitation is not authorized. Prospective investors in Bristol Gate’s pooled funds or ETF funds should rely solely on the fund’s offering documents, which outline the risk factors associated with a decision to invest. No representations or warranties of any kind are intended or should be inferred with respect to the economic return or the tax implications of any investment in a Bristol Gate fund.
This piece is presented for illustrative and discussion purposes only. It should not be considered as personal investment advice or an offer or solicitation to buy and/or sell securities and it does not consider unique objectives, constraints, or financial needs of the individual. Under no circumstances does this piece suggest that you should time the market in any way or make investment decisions based on the content. Investors are advised that their investments are not guaranteed, their values change frequently, and past performance may not be repeated. References to specific securities are presented to illustrate the application of our investment philosophy only, do not represent all of the securities purchased, sold or recommended for the portfolio, and it should not be assumed that investments in the securities identified were or will be profitable and should not be considered recommendations by Bristol Gate Capital Partners Inc. A full list of security holdings is available upon request. For more information contact Bristol Gate Capital Partners Inc. directly. The information contained in this piece is the opinion of Bristol Gate Capital Partners Inc. and/or its employees as of the date of the piece and is subject to change without notice. Every effort has been made to ensure accuracy in this piece at the time of publication; however, accuracy cannot be guaranteed. Market conditions may change and Bristol Gate Capital Partners Inc. accepts no responsibility for individual investment decisions arising from the use of or reliance on the information contained herein. We strongly recommend you consult with a financial advisor prior to making any investment decisions. Please refer to the Legal section of Bristol Gate’s website for additional information at bristolgate.com.
A Note About Forward-Looking Statements
This report may contain forward-looking statements including, but not limited to, statements about the Bristol Gate strategies, risks, expected performance and condition. Forward-looking statements include statements that are predictive in nature, that depend upon or refer to future events and conditions or include words such as “may”, “could”, “would”, “should”, “expect”, “anticipate”, “intend”, “plan”, “believe”, “estimate” and similar forward-looking expressions or negative versions thereof.
These forward-looking statements are subject to various risks, uncertainties and assumptions about the investment strategies, capital markets and economic factors, which could cause actual financial performance and expectations to differ materially from the anticipated performance or other expectations expressed. Economic factors include, but are not limited to, general economic, political and market factors in North America and internationally, interest and foreign exchange rates, global equity and capital markets, business competition, technological change, changes in government regulations, unexpected judicial or regulatory proceedings, and catastrophic events.
Readers are cautioned not to place undue reliance on forward-looking statements and consider the above-mentioned factors and other factors carefully before making any investment decisions. All opinions contained in forward-looking statements are subject to change without notice and are provided in good faith. Forward-looking statements are not guarantees of future performance, and actual results could differ materially from those expressed or implied in any forward-looking statements. Bristol Gate Capital Partners Inc. has no specific intention of updating any forward-looking statements whether as a result of new information, future events or otherwise, except as required by securities legislation.
 Takes 2 minutes