
June 11, 2023
This year has turned the age-old wisdom of one of the basic tenets of investing on its head -diversification. It serves as a vital safeguard against potential risks as by spreading investments across various asset classes, sectors, or geographic regions, investors reduce their exposure to any single investment’s volatility or failure. By diversifying their portfolios, investors aim to achieve a balance between risk and reward, optimizing the likelihood of long-term success.
Recently, much has been written about how a small subset of stocks are driving the market. How pronounced is the impact of these stocks? Eight stocks have contributed returns that exceed that of the rest of the constituents of the S&P 500. Stated another way, apart from those eight stocks, the remainder of the stocks in the index have remarkably delivered a negative return collectively:
Exhibit 1: S&P 500 YTD Returns (Market Cap Weighted vs Equal Weighted)
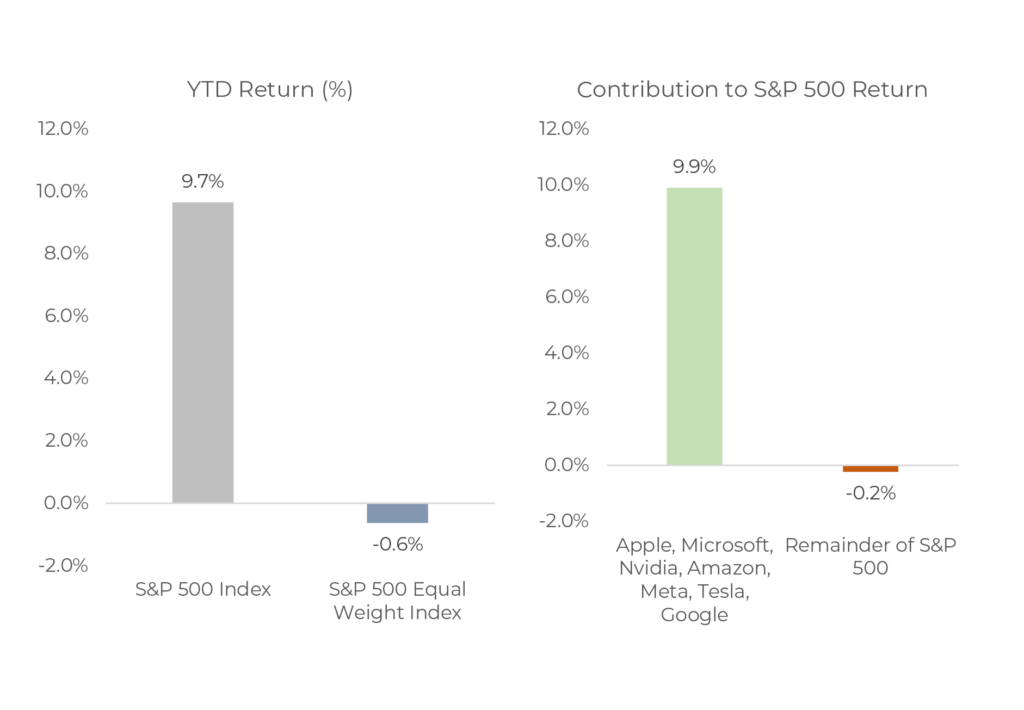
Source: Bloomberg, Morningstar. As at May 31, 2023.
Discerning investors should seriously question whether this type of dispersion in performance of the broad market relative to a small subset of companies is sustainable. 2020 was another year where the dispersion was quite wide, and in our fourth quarter commentary that year we wrote:
“According to S&P Global Indices, Apple, Amazon and Microsoft accounted for 53% of the SPX’s total return. Excluding those three stocks, the Index would have returned 8.6%. If the list were expanded to include the next seven largest contributors (only one of which paid a dividend and had no dividend growth), 77% of the Index’s total return was generated by the top ten holdings. Put another way, the other 495 stocks in the Index collectively returned 4.3%. All ten of the top contributors were technology or technology related stocks. The IT sector alone accounted for 64% of the Index’s return. Simply put, diversification hurt returns in 2020.”
With the benefit of hindsight, we now know that many of the market darlings of 2020, such as Peloton and Zoom would eventually succumb to gravity and plummet back to earth, like Icarus trying to ascent to the sun.
As they say, history doesn’t repeat itself, but it does rhyme. History tells us that this type of dispersion in performance between the S&P 500 market weighted and the equal weighted indices is at it’s widest since the tech bubble:
Exhibit 2:
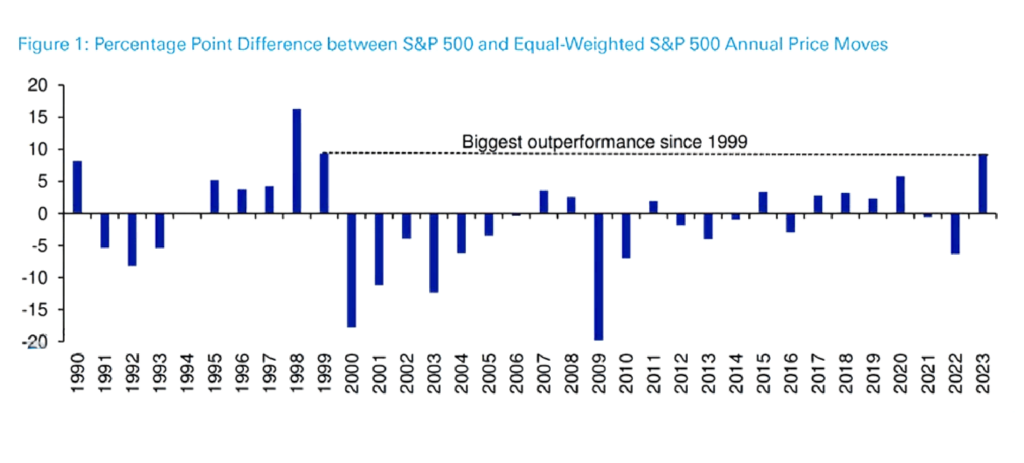
Source: Bloomberg Finance LP, Deutsche Bank
While the tech bubble is another well-known period where a small subset of stocks drove market returns, we can go back even further in time. The term “Nifty 50” was widely used refers to the late 1960s and early 1970s when a select group of stocks captured investors’ attention and became synonymous with market dominance and seemingly unstoppable growth. These companies were known for their established brands, strong market positions, and consistent earnings growth. Investors were drawn to the Nifty 50 due to the perception that they were “one-decision” stocks, meaning that they were considered long-term buy-and-hold investments that would always deliver superior returns. However, the market environment shifted dramatically in the early 1970s, and many of the Nifty 50 stocks experienced substantial declines in their stock prices, and investors who had heavily concentrated their portfolios in these stocks suffered significant losses. Economic conditions had become challenging, characterized by rising inflation, increasing interest rates, and a slowdown in earnings growth. Sound familiar?
What helps us navigate these types of challenging periods where the spotlight is on a select few market darlings is that we are consistently evaluating our stocks through the lens of our investment process. Our disciplined, evidence-based approach is designed to keep our focus on what is being obscured by the broad market and evaluating the companies in our portfolios not by their short-term price movements, but by the underlying earnings power of the businesses we own.
Exhibit 3: Bristol Gate US Equity Strategy and S&P 500 Index Operating Metrics
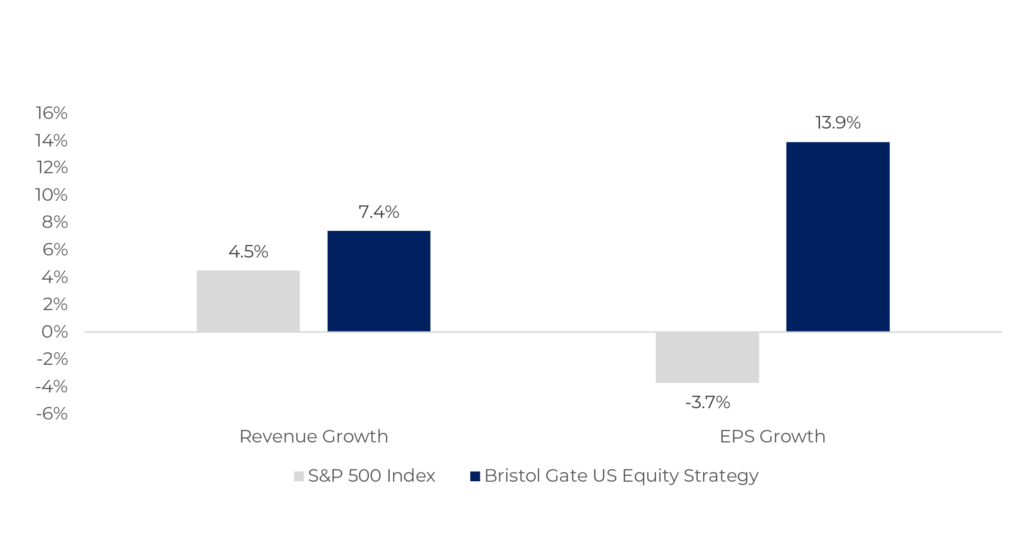
Source: Bristol Gate Capital Partners, Bloomberg, Zacks. As at June 5, 2023
With over 97% of companies in the S&P 500 reporting their first quarter earnings to date, earnings of the broad market are down on modest revenue growth. Our portfolio companies on the other hand, are delivering double-digit median earnings growth on high single-digit median revenue growth, which underscores the earnings power and operating leverage of the companies we own. Our fundamental belief that over time, the value of a business is inextricably tied to the income it can generate has not wavered. History tells us that, eventually, fundamentals will matter.
It is critical to consistently evaluate the drivers of the market we find ourselves in with a discerning eye to be able to properly contextualize the performance of any investment strategy. We intend to continue our series to provide a deeper understanding of our investable universe and our performance within it.
Important Disclosures
There is a risk of loss inherent in any investment; past performance is not indicative of future results. Prospective and existing investors in Bristol Gate’s pooled funds or ETF funds should refer to the fund’s offering documents which outline the risk factors associated with a decision to invest. Separately managed account clients should refer to disclosure documents provided which outline risks of investing. Pursuant to SEC regulations, a description of risks associated with Bristol Gate’s strategies is also contained in Bristol Gate’s Form ADV Part 2A located at www.bristolgate.com/regulatory-documents.
This piece is presented for illustrative and discussion purposes only. It should not be considered as personal investment advice or an offer or solicitation to buy and/or sell securities and it does not consider unique objectives, constraints, or financial needs of the individual. Under no circumstances does this piece suggest that you should time the market in any way or make investment decisions based on the content. Investors are advised that their investments are not guaranteed, their values change frequently, and past performance may not be repeated. References to specific securities are presented to illustrate the application of our investment philosophy only, do not represent all of the securities purchased, sold or recommended for the portfolio, it should not be assumed that investments in the securities identified were or will be profitable and should not be considered recommendations by Bristol Gate Capital Partners Inc. A full list of security holdings is available upon request. For more information contact Bristol Gate Capital Partners Inc. directly. The information contained in this piece is the opinion of Bristol Gate Capital Partners Inc. and/or its employees as of the date of the piece and is subject to change without notice. Every effort has been made to ensure accuracy in this piece at the time of publication; however, accuracy cannot be guaranteed. Market conditions may change and Bristol Gate Capital Partners Inc. accepts no responsibility for individual investment decisions arising from the use of or reliance on the information contained herein. We strongly recommend you consult with a financial advisor prior to making any investment decisions. Please refer to the Legal section of Bristol Gate’s website for additional information at bristolgate.com.
A Note About Forward-Looking Statements
This report may contain forward-looking statements including, but not limited to, statements about the Bristol Gate strategies, risks, expected performance and condition. Forward-looking statements include statements that are predictive in nature, that depend upon or refer to future events and conditions or include words such as “may”, “could”, “would”, “should”, “expect”, “anticipate”, “intend”, “plan”, “believe”, “estimate” and similar forward-looking expressions or negative versions thereof.
These forward-looking statements are subject to various risks, uncertainties and assumptions about the investment strategies, capital markets and economic factors, which could cause actual financial performance and expectations to differ materially from the anticipated performance or other expectations expressed. Economic factors include, but are not limited to, general economic, political and market factors in North America and internationally, interest and foreign exchange rates, global equity and capital markets, business competition, technological change, changes in government regulations, unexpected judicial or regulatory proceedings, and catastrophic events. Readers are cautioned not to place undue reliance on forward-looking statements and consider the above-mentioned factors and other factors carefully before making any investment decisions. All opinions contained in forward-looking statements are subject to change without notice and are provided in good faith. Forward-looking statements are not guarantees of future performance, and actual results could differ materially from those expressed or implied in any forward-looking statements. Bristol Gate Capital Partners Inc. has no specific intention of updating any forward-looking statements whether as a result of new information, future events or otherwise, except as required by securities legislation.
 Takes 2 minutes