
Performance Summary
During the quarter, both the US and Canadian Equity Strategies continued to outpace their respective benchmarks in terms of dividend growth. From a return perspective, US Equity Strategy portfolio underperformed the S&P 500 Total Return Index during the quarter. Our Canadian Equity Strategy outperformed the S&P/TSX Composite Total Return Index in the quarter. For a more detailed discussion on performance see each Strategy’s respective section below.
Portfolio Dividend Growth
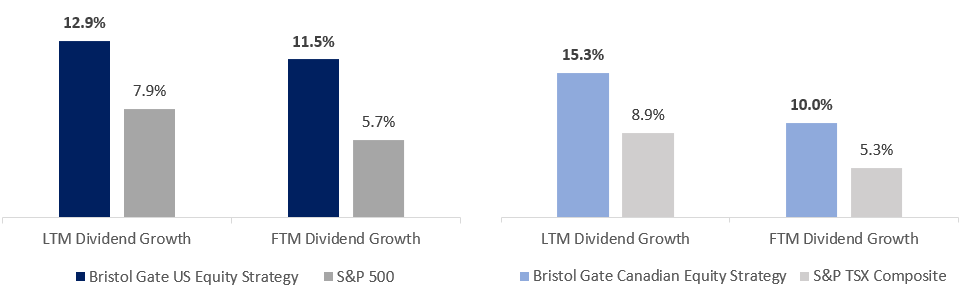
Note: LTM Dividend Growth is the median of the actual trailing 12-month dividend growth of the individual stocks held by Strategies or Index constituents as reported by Bloomberg as at Mar 31, 2023. FTM Dividend Growth is the median of the Bristol Gate Model’s forward 12-month prediction for the individual stocks held by the Strategies and the median of consensus estimates for the constituents of the Indices as of quarter end. Companies without a consensus dividend forecast were excluded, as were dividend initiators with no prior year comparative.
Source: Bloomberg, FactSet, Bristol Gate Capital Partners.
Commentary
Exiting 2022 the consensus view was that markets would have a rough start in 2023 with an early selloff as we entered a recession. Strategist after strategist called for a drop to previous lows followed by a second half recovery as the Fed cut rates to support the economy. Since then, we have experienced the second largest bank failure ever in the US with the collapse of Silicon Valley Bank and long-standing issues at more systemically important Credit Suisse finally led to its demise. Rates have continued to rise, and inflation has been persistent. US PMI data has been in contraction territory for five consecutive months and credit conditions have been tightening since Q3-21. Accordingly, analyst estimates for S&P 500 earnings have deteriorated from an estimated decline of 0.3% y/y on December 31, 2022 to a drop of 6.8% currently. Despite all of this, the S&P 500 rose 7.5% during the first quarter as investor expectations regarding the hiking cycle coming to an end shortly grew.
In today’s world we have access to an unprecedented amount of data and opinions on virtually any topic. We are constantly inundated with a seemingly endless stream of information from a variety of sources. While this abundance of data can be likened to a bottomless well of knowledge, it also presents a significant challenge: how to sift through
the vast quantity of information and determine what is valuable and what is not. That challenge is compounded by the complex, adaptive system that is the stock market which is characterized by aggregation (large scale behaviours from the collective interactions of the individual agents), adaptive decision rules, nonlinearity and feedback loops. Often the outcomes we expect are not the ones that materialize, and if they do, perhaps not in the timeframe we envisioned.
We think investors are rightfully concerned about interest rates rising, uncertainty in the financial sector, constantly changing expectations regarding monetary policy and the implications of all these matters on the markets in the short-term. We ourselves are very concerned about the ultimate impact the recent bank failures will have on markets and the broader economy. Approximately 40% of all loans in the US are made by the small and medium sized banks who are experiencing the largest challenges with respect to deposit outflows and higher cost funding. We expect credit conditions to continue tightening, possibly materially. However, we must realize the deeply uncertain decision-making environment we continually operate in and the possibility that our view may be wrong. As Socrates said, “All I know is that I know nothing.” As such, we believe our responsibility is not to build a portfolio to suit our macro view but instead build a portfolio in spite of it, one that recognizes the myriad of possible outcomes and is resilient regardless of which path we go down in the near term.
Over the long term, our view that company fundamentals drive stock returns and that the income an asset produces, and its value are directly related over time is unwavering. We are not in the speculation business. We firmly believe the best way to insulate our clients during uncertain periods is by taking ownership stakes in businesses that we believe can grow irrespective of the macroeconomic conditions being faced and when faced with the choice of quality or valuation, we believe erring on the side of quality is the best path to follow. Finally, we would be remiss not to mention the main objective we are trying to achieve. Growing our clients’ income at rates well above the market, year in and year out, irrespective of what the macro environment throws our way. Although that growing income stream may not be appreciated by the market at certain points in time, over time we believe it matters. If we can continue identifying high growing dividend streams before others, we think our investors will ultimately be well served.
Exhibit 1: US Equity Strategy Constituent Annual Dividend Growth
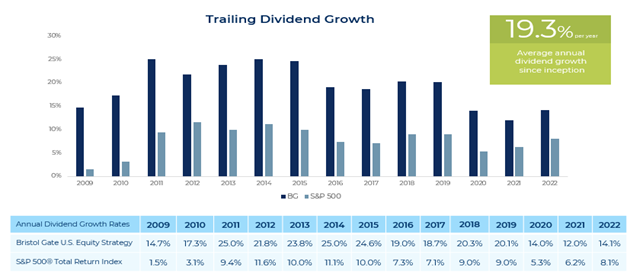
As at December 31, 2022. Source: Bloomberg. Median of the annual trailing 12-month dividend growth (as reported on Bloomberg) of the individual stocks held at the end of each calendar year. There is a risk of loss inherent in any investment; past performance is not indicative of future results.
US Equity Strategy (all returns USD)
The US Equity strategy slightly underperformed the S&P 500 Index in Q1 (see Exhibit 5). The Index shrugged off the short-lived volatility the banking failures brought and the highest number of companies issuing negative earnings guidance since 2019, according to FactSet.
Our relative underperformance was primarily driven by stock selection in the Information Technology and Consumer Discretionary sectors, as our more defensive holdings lagged the index. This was partially offset by stock selection in Financials and Health Care. On an absolute basis, Applied Materials, MSCI and Microsoft were among our largest contributors, while Dollar General, UnitedHealth and Sherwin-Williams were among the largest detractors. Dollar General and UnitedHealth were two of our best performers in 2022. Dollar General in particular, was trimmed as part of our regular rebalancing process in Q422, near its highs, highlighting the effectiveness of this systematic component of our process. A more nuanced view of the market’s returns shows how bifurcated it was. In the first three months of the year, the largest 20 stocks in the S&P 500 by market capitalization rose by 16%, while the remaining 480-odd stocks rose collectively by just 2%.
Exhibit 2: Change in Market Capitalization of Top 20 vs Remaining S&P 500 Index Constituents
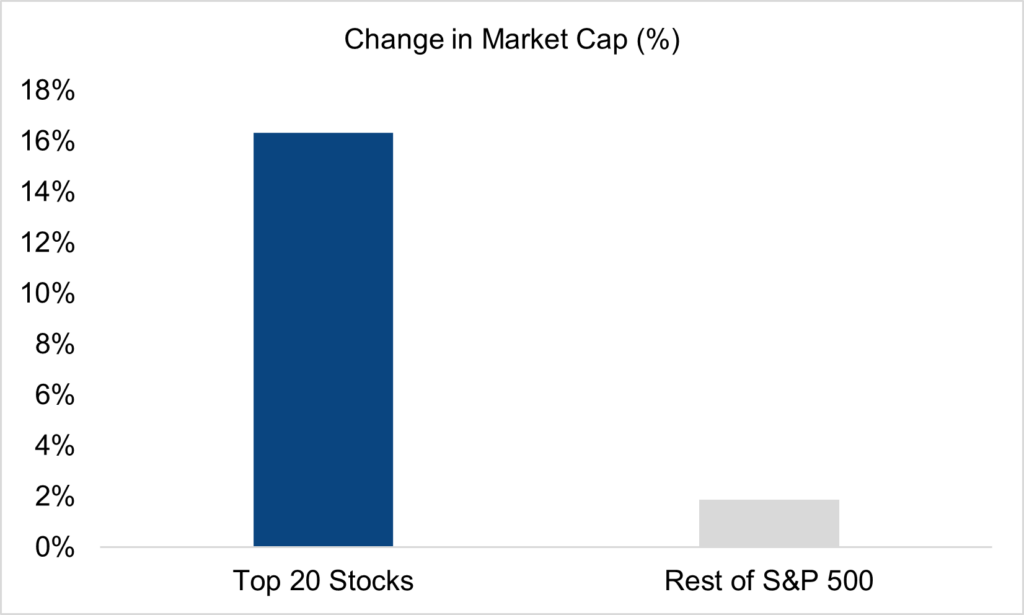
Source: Bloomberg. From Jan 1, 2023 to March 31, 2023.
The stock returns of six companies (Apple, Nvidia, Tesla, Meta, Amazon and Alphabet) were more than 500 basis points of relative headwind on their own. Four of those companies do not pay a dividend, the other two do not meet our dividend growth objectives. An equally weighted basket of all dividend payers in the S&P 500 returned 1.6% during the quarter, while companies that grew their dividend in the last year were up 1.2% on average. Non dividend paying stocks carried the market returns, up an average of 11.9% in during the first three months of the year. In particular, the Information Technology sector rose over 24% in the first quarter even though the number of companies reporting negative guidance in the sector tied the highest since FactSet started tracking the figure in 2006.
Despite the uncertain macro environment, through March 31, seven portfolio companies have announced dividend increases averaging 19.2%. We believe the historical and expected (using consensus estimates) operating performance of our portfolio compares favourably to the broader market. In our view, owning high quality businesses
that are underpinned by strong balance sheets, that have numerous growth opportunities, generate higher cash returns and more consistent results and buying them at fair prices is the best way to compound returns over the long term.
Exhibit 3: Bristol Gate US Equity Portfolio Operating Metrics vs S&P 500 Index
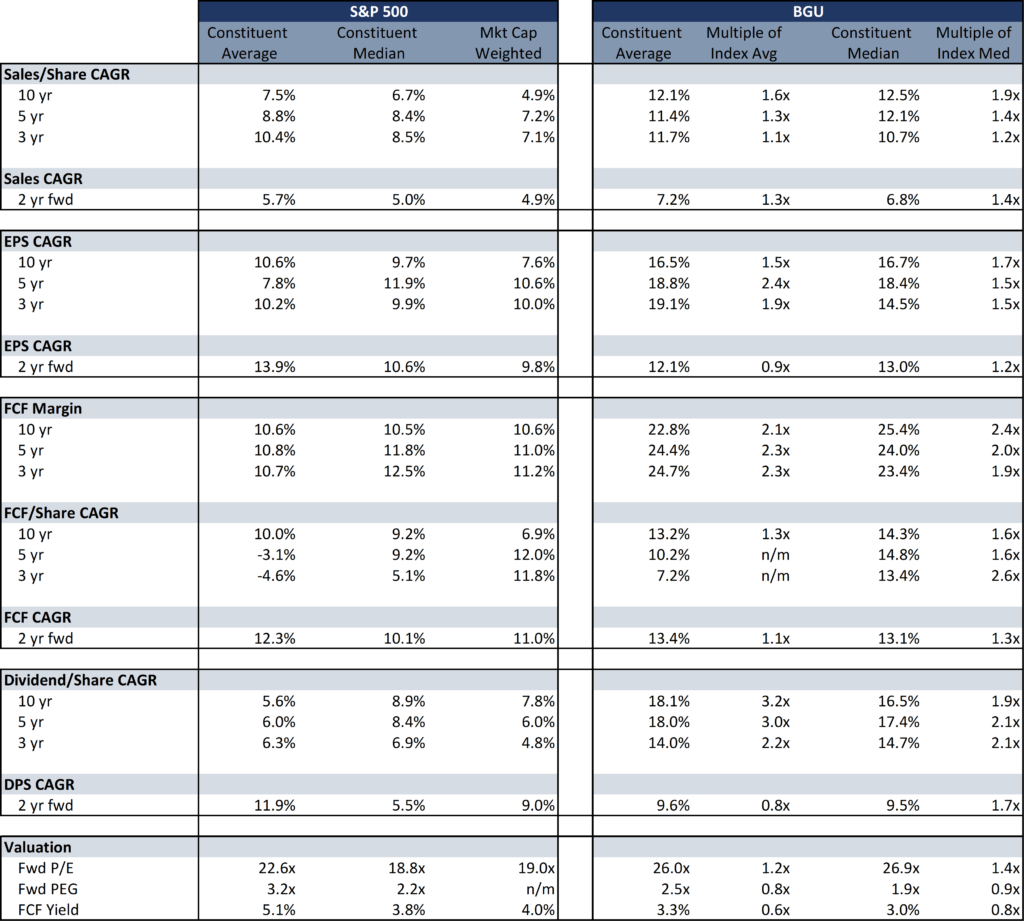
Note: As at March 9, 2023. Figures are based on the companies’ last completed fiscal year. Data points that were not meaningful or missing were excluded from average and median calculations. Forward estimates based on consensus estimates. Source: Bloomberg, Bristol Gate Capital Partners.
Although our holdings trade at a premium valuation to the market, we think they are attractively priced considering their relative operating metrics, consistency and future opportunities. Looking at the past five years, despite consistently trading at a valuation premium on a forward P/E basis, the maximum multiple compression our portfolio experienced was less than the broad market.
Exhibit 4: Maximum Multiple Compression of Bristol Gate US Equity Portfolio vs S&P 500 (Last 5 Years)
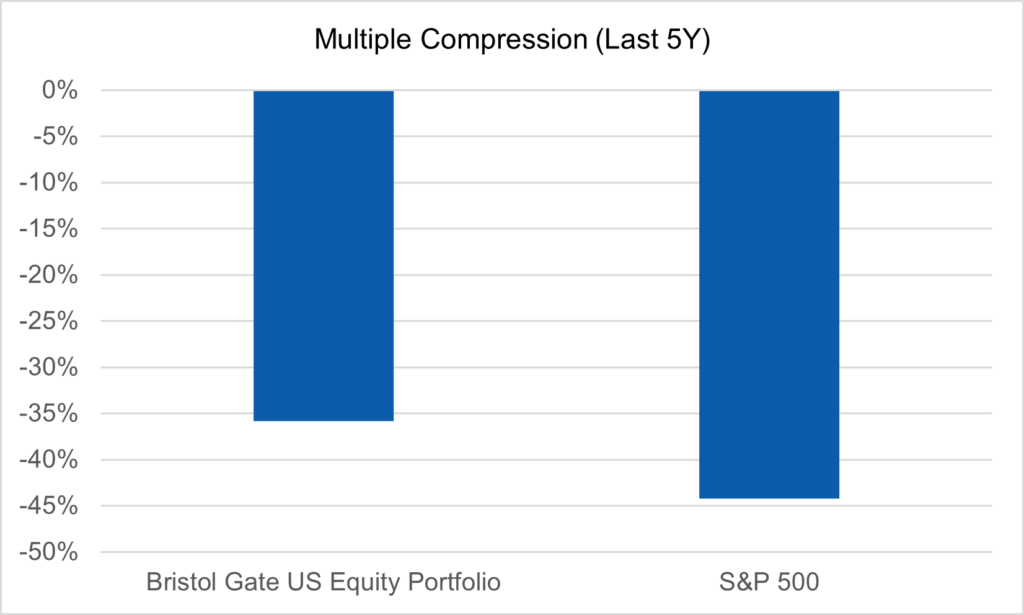
Source: Bloomberg, Bristol Gate Capital Partners.
The importance of quality cannot be underestimated. Even in the challenging macro environment we find ourselves in, our portfolio companies have been able to maintain their margins and deliver exceptional earnings growth thanks to their operating leverage.
During the quarter, we sold Advance Auto Parts (AAP) and replaced it with Corteva (CTVA). We also trimmed our stakes in Broadcom and Zoetis as part of our regular rebalancing process.
With AAP, we expected the operational changes they were making to lead to a better run organization with leaner inventories and more cash generation. While that may still happen, it was not happening in the timeframe we envisioned. Instead, inventories are moving up and cash flow is moving down as they respond to competitive actions and address some of their own missteps. We have no expectation for the current trends to reverse in the next year or two, so we moved on.
In CTVA we acquired a pure play agricultural company, that is a market leader in seeds and crop protection chemicals. Underlying farmer fundamentals are strong, driven by high crop prices and low inventory levels. CTVA has an attractive pipeline of opportunities to drive double digit earnings growth annually to 2025. We expect dividend growth to at least match earnings growth over that timeframe and find the current valuation attractive in light of that.
In addition to selling Advance Auto Parts (Consumer Discretionary) and buying Corteva (Materials), sector weightings changed compared to the prior quarter due to GICS sector classification changes (Visa & Mastercard moving from Technology to Financials and Dollar General moving from Consumer Discretionary to Consumer Staples).
Exhibit 5: US Equity Strategy Risk and Return Metrics
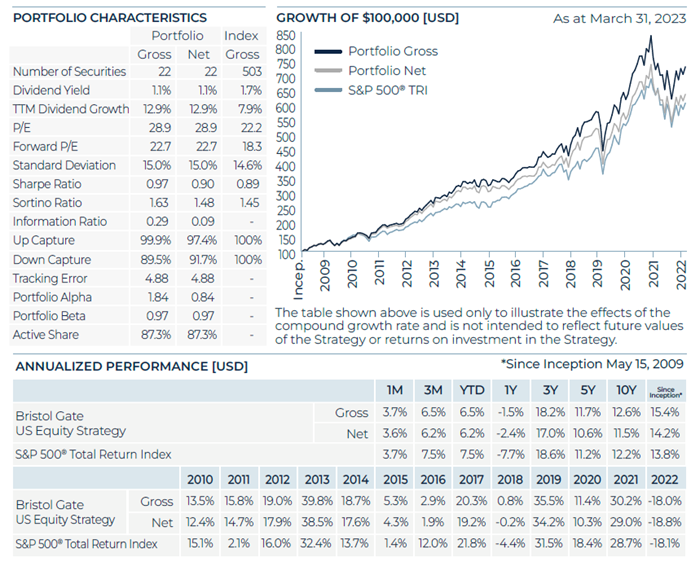
Source: Bristol Gate Capital Partners. There is a risk of loss inherent in any investment; past performance is not indicative of future results. Please see important disclosures at end of document.
Canadian Equity Strategy (all returns CAD)
The first quarter of 2023 saw the S&P/TSX Composite Index rise by 4.6%. At the sector level, the market was a mixed bag as the Energy sector posted a negative return, while the Information Technology sector rose by more than 25%. Market returns were more muted after a strong January as the Bank of Canada diverged from the Federal Reserve as, after raising rates in January, they held rates level in March over concerns in the housing sector and fears of hiking into a recession. This also had a ripple effect on the performance of the Financials sector. Global developments were also a cause for concern, as the collapse of Silicon Valley Bank and Credit Suisse added to market volatility.
Against this backdrop, the Canadian Equity portfolio outperformed, continuing a trend of strong relative performance. Our lack of exposure to the underperforming Energy sector as well as both our overweight and stock selection in the Consumer Staples and Real Estate sectors were the primary contributors to outperformance. Open Text, Premium Brands Holdings and CCL Industries were among the leading contributors in the quarter, highlighting a strength of our disciplined rebalancing process which saw us add to our positions when their weights fell below our thresholds in 2022.
As part of our regular quarterly rebalancing process, we added to our holdings in Telus and Jamieson Wellness, while trimming our weights in Element Fleet Financial and Enghouse Systems. As part of a corporate action, we sold our shares of the Brookfield Asset Management spinoff and reinvested the proceeds into Brookfield Corp.
Our companies continue to deliver strong operating results. So far 12 companies have announced dividend increases this year, raising their payments by a healthy 12% on average, which we view as very strong given the testing environment we find ourselves in. Following Q422 results, where 15 of our 23 portfolio companies exceeded revenue or earnings forecasts, and the portfolio holdings on average grew their revenues by 12.4% and earnings by 14.7%, we expect another solid reporting quarter in Q123. We believe the strong performance of the strategy over the quarter, and indeed the past 12 months, is a reward for the patience we have shown with these high-quality businesses, as the strong fundamentals we have consistently highlighted are being recognized by the market.
Exhibit 6. Canadian Equity Strategy Risk and Return Metrics
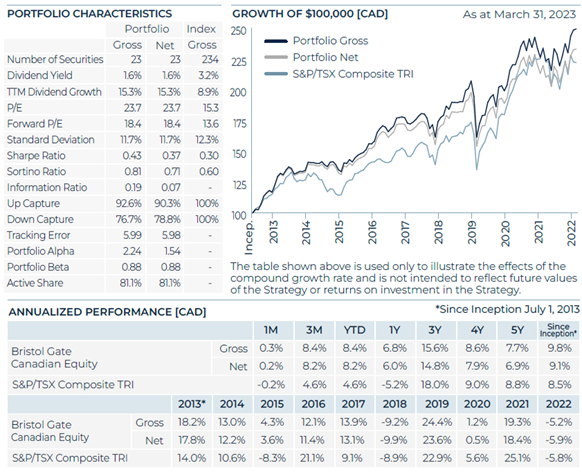
Source: Bristol Gate Capital Partners. There is a risk of loss inherent in any investment; past performance is not indicative of future results. Please see important disclosures at end of document.
Firm Update
To start the year, we have continued to make efforts to ensure that as a firm we are working in the most collaborative manner possible to ensure the best possible results for our clients and partners. As successful as we have been in operating in a hybrid work environment, we are always looking for ways to improve. As such, we are instituting one day a week where all of our employees are required to be in the office to maintain high levels of communication across the firm.
In addition, senior management have instituted an annual organizational feedback review process that involves all employees to determine how we can enhance our work culture for both our employees as individuals and as a firm.
To all our clients, thank you for your ongoing support and trust. We are determined to do everything we can to provide you continued income growth and strong investment returns going forward.
Sincerely,
The Bristol Gate Team
DISCLAIMER: This piece is presented for illustrative and discussion purposes only. It should not be considered as personal investment advice or an offer or solicitation to buy and/or sell securities and it does not consider unique objectives, constraints, or financial needs of the individual. Under no circumstances does this piece suggest that you should time the market in any way or make investment decisions based on the content. Investors are advised that their investments are not guaranteed, their values change frequently, and past performance may not be repeated. References to specific securities are presented to illustrate the application of our investment philosophy only, do not represent all of the securities purchased, sold or recommended for the portfolio, and it should not be assumed that investments in the securities identified were or will be profitable and should not be considered recommendations by Bristol Gate Capital Partners Inc. A full list of security holdings is available upon request. For more information contact Bristol Gate Capital Partners Inc. directly. The information contained in this piece is the opinion of Bristol Gate Capital Partners Inc. and/or its employees as of the date of the piece and is subject to change without notice. Every effort has been made to ensure accuracy in this piece at the time of publication; however, accuracy cannot be guaranteed. Market conditions may change and Bristol Gate Capital Partners Inc. accepts no responsibility for individual investment decisions arising from the use of or reliance on the information contained herein. We strongly recommend you consult with a financial advisor prior to making any investment decisions. Please refer to the Legal section of Bristol Gate’s website for additional information at bristolgate.com
Important disclosures
There is a risk of loss inherent in any investment; past performance is not indicative of future results. Prospective and existing investors in Bristol Gate’s pooled funds or ETF funds should refer to the fund’s offering documents which outline the risk factors associated with a decision to invest. Separately managed account clients should refer to disclosure documents provided which outline risks of investing. Pursuant to SEC regulations, a description of risks associated with Bristol Gate’s strategies is also contained in Bristol Gate’s Form ADV Part 2A located at www.bristolgate.com/regulatory-documents.
Gross returns in this report refer to the Bristol Gate US Equity Strategy Composite and Canadian Equity Strategy Composite. No allowance has been made for custodial costs, taxes, operating costs, management and performance fees, which will reduce performance. Past performance is not indicative of future results. Allowance for withholding tax in the US strategy composite is partially reflected in the composite returns for periods commencing January 2017 and after. The Net returns for the Bristol Gate US Equity Strategy Composite and Canadian Equity Strategy Composite are reflective of the maximum management fee charged by Bristol Gate of 1% and 0.70%, respectively.
The Bristol Gate US Equity Strategy Composite was formerly known as the Bristol Gate US Dividend Growth Composite until April 1, 2015. The Composite inception date was May 15, 2009. The Composite consists of equities of publicly traded, dividend paying US companies and is valued in US Dollars.
The Bristol Gate Canadian Equity Strategy Composite was formerly known as the Bristol Gate Canadian Dividend Growth Composite until April 1, 2015. The Composite inception date was July 1, 2013. The Composite consists of equities of publicly traded, dividend paying Canadian and US companies and is valued in Canadian Dollars.
The S&P 500® Total Return Index measures the performance of the broad US equity market, including dividend re-investment, in US dollars. This index is provided for information only and comparisons to the index has limitations. The benchmark is an appropriate standard against which the performance of the strategy can be measured over longer time periods as it represents the primary investment universe from which Bristol Gate selects securities. However, Bristol Gate’s portfolio construction process differs materially from that of the benchmark and the securities selected for inclusion in the strategy are not influenced by the composition of the benchmark. For example, the strategy is a concentrated portfolio of approximately equally weighted dividend-paying equity securities, rebalanced quarterly whereas the benchmark is a broad stock index (including both dividend and non-dividend paying equities) that is market capitalization weighted. As such, strategy performance deviations relative to the benchmark may be significant, particularly over shorter time periods. The strategy has concentrated investments in a limited number of companies; as a result, a change in one security’s value may have a more significant effect on the strategy’s value.
SPDR S&P 500 ETF Trust (SPY US) sourced from Bloomberg has been used as a proxy for the S&P 500® for the purpose of providing non-return based portfolio statistics and sector weightings.
The S&P/TSX Total Return Index measures the performance of the broad Canadian equity market, including dividend re-investment, in Canadian dollars. This index has been provided for information only and comparisons to the index has limitations. The benchmark is an appropriate standard against which the performance of the strategy can be measured over longer time periods as it represents the primary investment universe from which Bristol Gate selects securities. However, Bristol Gate’s portfolio construction process differs materially from that of the benchmark and the securities selected for inclusion in the strategy are not influenced by the composition of the benchmark. For example, the strategy is a concentrated portfolio of approximately equally weighted dividend-paying equity securities, rebalanced quarterly whereas the benchmark is a broad stock index (including both dividend and non-dividend paying equities) that is market capitalization weighted. As such, strategy performance deviations relative to the benchmark may be significant, particularly over shorter time periods. The strategy has concentrated investments in a limited number of companies; as a result, a change in one security’s value may have a more significant effect on the strategy’s value.
iShares Core S&P/TSX Capped Composite Index ETF (XIC CN) sourced from Bloomberg has been used as a proxy for the S&P/TSX Total Return Index for the purpose of providing non-return based portfolio statistics and sector weightings.
There is the opportunity to use leverage up to 30% of the net asset value. Leverage is not used as an investment tool to enhance returns, but for cash management needs of certain composite portfolios.
This Report is for information purposes and should not be construed under any circumstances as a public offering of securities in any jurisdiction in which an offer or solicitation is not authorized. Prospective investors in Bristol Gate’s pooled funds or ETF funds should rely solely on the fund’s offering documents, which outline the risk factors associated with a decision to invest. No representations or warranties of any kind are intended or should be inferred with respect to the economic return or the tax implications of any investment in a Bristol Gate fund.
Bristol Gate claims compliance with the Global Investment Performance Standards [GIPS®]. To receive a list of composite descriptions and/or a presentation that complies with the GIPS® standards, please contact us at info@bristolgate.com. Bristol Gate Capital Partners Inc. has been independently verified for the periods commencing May 2009 until December 2015 by Ashland Partners International PLLC and from January 1, 2016 – December 31, 2020 by ACA Group, Performance Services Division.
This piece is presented for illustrative and discussion purposes only. It should not be considered as personal investment advice or an offer or solicitation to buy and/or sell securities and it does not consider unique objectives, constraints, or financial needs of the individual. Under no circumstances does this piece suggest that you should time the market in any way or make investment decisions based on the content. Investors are advised that their investments are not guaranteed, their values change frequently, and past performance may not be repeated. References to specific securities are presented to illustrate the application of our investment philosophy only, do not represent all of the securities purchased, sold or recommended for the portfolio, and it should not be assumed that investments in the securities identified were or will be profitable and should not be considered recommendations by Bristol Gate Capital Partners Inc. A full list of security holdings is available upon request. For more information contact Bristol Gate Capital Partners Inc. directly. The information contained in this piece is the opinion of Bristol Gate Capital Partners Inc. and/or its employees as of the date of the piece and is subject to change without notice.
Every effort has been made to ensure accuracy in this piece at the time of publication; however, accuracy cannot be guaranteed. Market conditions may change and Bristol Gate Capital Partners Inc. accepts no responsibility for individual investment decisions arising from the use of or reliance on the information contained herein. We strongly recommend you consult with a financial advisor prior to making any investment decisions. Please refer to the Legal section of Bristol Gate’s website for additional information at bristolgate.com.
A Note About Forward-Looking Statements
This report may contain forward-looking statements including, but not limited to, statements about the Bristol Gate strategies, risks, expected performance and condition. Forward-looking statements include statements that are predictive in nature, that depend upon or refer to future events and conditions or include words such as “may”, “could”, “would”, “should”, “expect”, “anticipate”, “intend”, “plan”, “believe”, “estimate” and similar forward-looking expressions or negative versions thereof.
These forward-looking statements are subject to various risks, uncertainties and assumptions about the investment strategies, capital markets and economic factors, which could cause actual financial performance and expectations to differ materially from the anticipated performance or other expectations expressed. Economic factors include, but are not limited to, general economic, political and market factors in North America and internationally, interest and foreign exchange rates, global equity and capital markets, business competition, technological change, changes in government regulations, unexpected judicial or regulatory proceedings, and catastrophic events.
Readers are cautioned not to place undue reliance on forward-looking statements and consider the above-mentioned factors and other factors carefully before making any investment decisions. All opinions contained in forward-looking statements are subject to change without notice and are provided in good faith. Forward-looking statements are not guarantees of future performance, and actual results could differ materially from those expressed or implied in any forward-looking statements. Bristol Gate Capital Partners Inc. has no specific intention of updating any forward-looking statements whether as a result of new information, future events or otherwise, except as required by securities legislation.
 Takes 2 minutes