
Performance Summary
During the quarter, both the US and Canadian Equity Strategies continued to outpace their respective benchmarks in terms of dividend growth. From a return perspective, US Equity Strategy portfolio outperformed the S&P 500 Total Return Index during the quarter. Our Canadian Equity Strategy underperformed the S&P/TSX Composite Total Return Index in the quarter. For a more detailed discussion on performance see each Strategy’s respective section below.
Dividend Growth
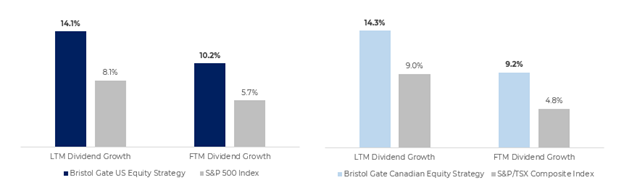
Note: LTM Dividend Growth is the median of the actual trailing 12-month dividend growth of the individual stocks held by Strategies or Index constituents as reported by Bloomberg as at Dec 31, 2022. FTM Dividend Growth is the median of the Bristol Gate Model’s forward 12-month prediction for the individual stocks held by the Strategies and the median of consensus estimates for the constituents of the Indices as of quarter end. Companies without a consensus dividend forecast were excluded. Return commentary based on gross returns.
Source: Bloomberg, FactSet, Bristol Gate Capital Partners.
Commentary
2022 proved to be a difficult year for public market investors. There was no escaping the negative effects rising inflation and tightening monetary policy had on asset values. The S&P 500 had its worst year since the Global Financial Crisis, declining over 18% and investors were unable to find shelter in fixed income with the US Aggregate Bond Index declining over 12%.
During periods like these, it is easy to get caught up in the here and now. Focusing on the daily fluctuations of the market can make investors lose sight of the bigger picture, often resulting in hasty decisions based on short-term market trends. Whenever we are faced with difficult market conditions, we always remind ourselves to zoom out.
Zooming out can be important in a number of contexts, as it allows one to take a broader perspective on a situation or problem. This can help to identify patterns or trends that might not be immediately visible when focused on the details. It can also provide a sense of context and help to put things into perspective, which can be useful when making decisions or trying to understand a complex issue.
Lastly, zooming out can help to identify the bigger picture and facilitate the development of long-term strategies or plans.[1] Often when zooming out, things don’t look so bad. If we look at the last five years instead of just the last one, our US strategy has generated a compounded annual return (CAGR) of 10.2% (gross) (9.1% net), the S&P 500 Total Return Index a CAGR of 9.4%, and the S&P Dividend Aristocrats Total Return Index a CAGR of 9.8%. We think those are attractive results considering experiencing two bouts of Fed tightening (2016-2019 and again now), a global pandemic and the economic fallout resulting from it, a major war in Europe and rising tensions between the world’s two superpowers, amongst other negative events. Even after the market decline this year, many investors are well ahead of plan in reaching their long-term financial goals.
Exhibit 1. Bristol Gate US Equity Strategy and Select S&P Index Total Returns (Growth of $100)
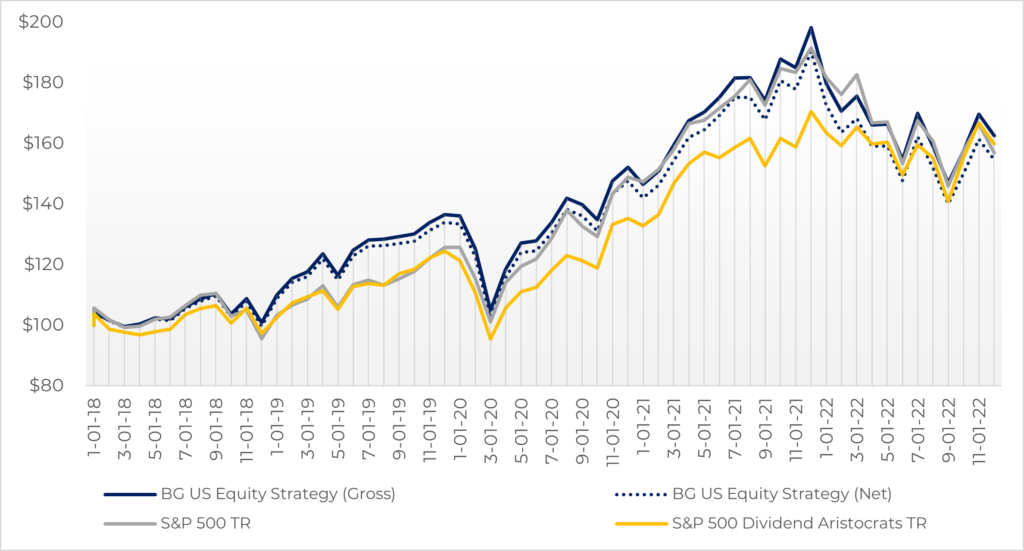
As at Dec 31, 2022. Source: Morningstar, Bristol Gate Capital Partners. There is a risk of loss inherent in any investment; past performance is not indicative of future results. Please see Exhibit 5 below for full performance history of the Bristol Gate US Equity Strategy and see Important Disclosures at end of document.
[1] This paragraph was written by OpenAI’s ChatGPT, which we spent some time fiddling around with over the holidays.
Zooming out also allows us to focus on the things we can control and continue making the investments necessary to drive our business or investor financial goals forward. While we don’t know when the Fed will stop raising rates or whether we will be pushed into a recession before they do, a broader perspective tells us that markets will eventually recover. They always have, particularly the good companies with solid balance sheets and underlying fundamentals. That knowledge allows us to continue investing for the future, with the goal of those investments driving improved outcomes for our investors.
In that regard, we wanted to take this opportunity to update our clients on two investments made in the last year. The first focused on our continuous efforts to optimize the decision making and performance of our Investment Committee (IC) and the second related to our dividend predictions.
Investment Committee Review
Renowned behaviour psychologist Daniel Kahneman wrote ‘wherever there is judgement, there is noise – and more of it than you think… To understand error in judgment, we must understand both bias and noise.
We believe a disciplined, evidence-based approach will serve our investors and partners better. This is why we built our firm with evidence and data at the centre, rather than individual and ego. Understanding bias and noise is important to our decision-making process and ensuring we don’t stray from our focus.
In this vein, we hired BehaviorQuant (“BQ”), the brainchild of Thomas Oberlechner, an expert in behavioral finance and financial psychology to examine our IC. Mr. Oberlechner holds a psychology doctorate and three Masters’ degrees in law, psychology, and consulting psychology from Harvard University and University of Vienna. BQ use psychometrics and machine learning to quantify decision makers’ behavioral characteristics, preferences, and biases. BQ has worked with hundreds of different teams of investment managers and some of the world’s largest trading floors to build a database to determine what drives people in the financial business. Behavioral Quant’s own findings have shown that by choosing the wrong investment team an investor’s return is approximately 33% below that of a team well suited to one another.
We think a thorough evaluation of all firm risks, including an expert analysis of the people responsible for the stewardship of client assets should be undertaken regularly. If we can ensure that our Investment Committee fits well together, use our collective strengths and improve on our weaknesses, we will be better at understanding how to optimize our investment decision making for the benefit of investors. By identifying invisible decision biases and harmful behavioral tendencies, we think we are better able to limit the harmful noise Kahneman is referring to.
Our intention in engaging BQ was to systematically evaluate all members of the investment team, identify any red flags, and develop a plan to improve our individual and collective decision making. Each member was subjected to a test, measuring their personality characteristics, assessing competencies and measuring risk capacity and tolerance. Scores were measured individually and then consolidated into an overall team analysis. Our team scores were then analyzed against hundreds of other investment teams.
While there are always areas for improvement, our overall team results were exactly what we were hoping for. We have a team that operates with strongly shared convictions regarding the process, believe in the power of dividend growth, but are also not afraid to share their ideas and challenge convention and each other in a respectful and open manner.
Distant Future Prediction
Bristol Gate uses data-science driven predictions as part of its investment process in conjunction with fundamental analysis. Through the research being done by our data science team, we have concluded we can materially improve our performance potential if we can extend our dividend prediction horizon. This is aligned with the fact that the earlier a signal is captured, the greater its potential. Exhibit 2 below details the results of our testing based on having perfect foresight. That is, knowing and investing in the fastest dividend growers in advance of the forecast horizon. Portfolio 1 (blue line) is composed of the top quartile of the fastest dividend growers over period “X”. We will call it the “Near Future Prediction”. Portfolio 2 (red line) is composed of the top quartile of the fastest dividend growers over period “Y”. Period “Y” is greater than period “X”. We will call it the “Distant Future Prediction”. Both portfolios are reconstituted annually, with no other trading occurring in the intervening period.
Exhibit 2. Annual Excess Return vs. S&P 500 Total Return Index – Perfect Foresight
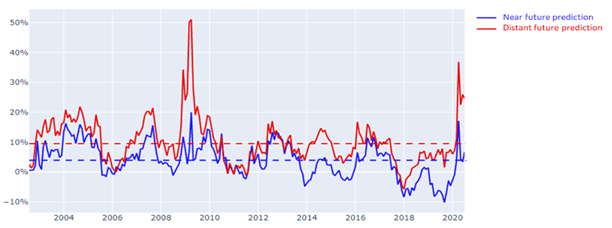
Note: Dashed lines are median excess returns over the period presented.
Source: FactSet, Bristol Gate Capital Partners.
You can see that based on perfect foresight, the Distant Future Prediction consistently and meaningfully outperforms the Near Future Prediction. This is the theoretical alpha opportunity of moving to a Distant Future prediction.
One issue with which all forecasters struggle is that the further out the prediction, the higher the uncertainty. This is because the range of possible outcomes expands exponentially the further out we look. Real world challenges (changing macro conditions, random events like COVID, unforeseen competitive responses, etc.) mean that we never expect to fully capture the theoretical alpha opportunity. We will never be able to predict with 100% accuracy.
However, Exhibit 3 tells us that we should be willing to sacrifice accuracy for a longer prediction horizon. Again, based on the perfect foresight portfolio, at anything better than a 20% hit rate (we only get one in five of the top quartile of dividend growers over the forecast horizon right), the probability of outperforming our benchmark Index is higher with Distant Future Prediction (the red line is above the blue line in the graph below).
Exhibit 3. Probability of Outperformance vs. Hit Rate – Perfect Foresight
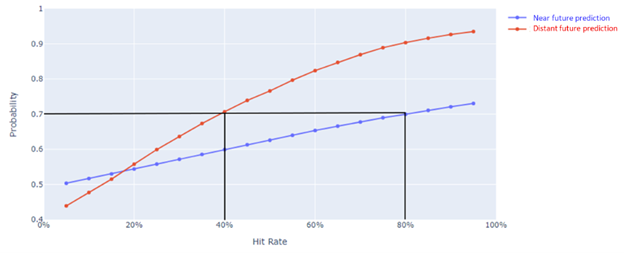
Source: FactSet, Bristol Gate Capital Partners.
Said another way, having an 80% hit rate with Near Future Prediction Horizon provides the same probability of outperformance (70%) as a 40% hit rate with the Distant Future Prediction horizon. The historical data suggests that we are well compensated despite being less accurate. In addition, the slope of the line (hit rate vs probability of outperformance) for the Distant Future Prediction is steeper, almost twice that of its counterpart for the Near Future Prediction. Therefore, any improvement in forecast accuracy has a much larger impact on the Distant Future model compared to the Near Future one.
Given the results above, we have spent the last year building a new model to extend our prediction horizon. The new model is built leveraging the knowledge we accumulated over years of predicting dividend growth and the early results are encouraging.
Exhibit 4. Distant Future Prediction vs Current Prediction Annual Return Difference – 1Y Holding Period
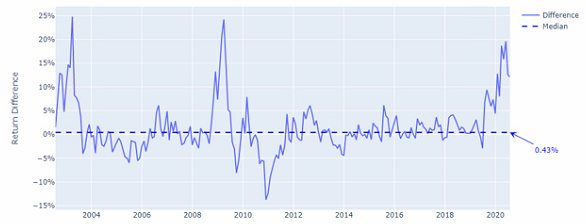
Source: FactSet, Bristol Gate Capital Partners.
Exhibit 4 plots the excess return of the top quartile of dividend growers of our new Distant Future model compared to our current one. Despite an approximate 30% lower hit rate in terms of accuracy, our Distant Horizon model outperformed our current version in back testing. Upon analysis, this model outperformance is consistent over holding periods ranging from one to three years. Extending our forecast, even with lower accuracy, clearly tilts the odds of outperforming our benchmark further in our favour. While that annual outperformance may seem minimal, even small differences compounded over time can add up to meaningful amounts.
While we are excited with all the above, we do not want to set unrealistic expectations. We are early in the process of eventually putting the Distant Future Prediction into production. We have a lot of work ahead of us and the new prediction does not come without its own set of challenges. We will be spending the coming months continuing to work to improve our hit rate and analyzing the data to better understand such things as impact on turnover, volatility and other risk related metrics. We want to ensure what we have seen in the lab ultimately translates to real world application. If we can improve our hit rate from these initial results, the opportunity appears very interesting.
US Equity Strategy (all returns USD)
The US Equity strategy outperformed the S&P 500 Index during the quarter. While we are never happy with a negative return, we were encouraged that the portfolio was able to make up almost all of the 700 basis point performance deficit (net basis) it faced relative to the S&P 500 Index at the end of Q1/22. At the time we wrote the following:
We believe our investment discipline of owning high quality companies, with good balance sheets that can grow their dividends at exceptional rates over the longer term will eventually return in favour and will provide competitive returns through the entire economic cycle. Although our investment performance has been disappointing this quarter, we have not been disappointed with the aggregate financial results of our companies.
We followed that up with this in our Q3/22 note:
During times like these quality matters because stability and consistency of earnings combined with dividend growth is often more appreciated by the market when there is a lack of it available. We believe we are in one of those periods now. The quality and resilience of our portfolios are critical in allowing us to look through the current turbulence with optimism and predict into the future with some degree of confidence. Our holdings have the ability and willingness to continue investing through the uncertainty, increasing their competitive advantages and coming out stronger on the other end. They have done so in the past and we expect the same going forward.
Over the trailing 12 months (the December quarter has yet to be reported), our portfolio companies have averaged double digit revenue and EPS growth and their latest quarterly dividends were ~18% higher than the year ago period. After some great companies were thrown out with the bathwater to start the year, we believe the quality of the companies we own was better reflected by the market as the year wore on, with the portfolio rising ~5% in the second half of the year compared to the market’s ~2% increase.
Exhibit 5: US Equity Strategy Risk and Return Metrics
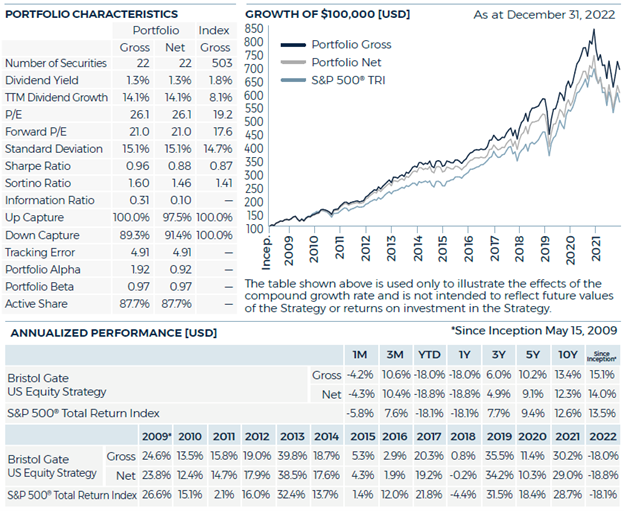
Source: Bristol Gate Capital Partners. There is a risk of loss inherent in any investment; past performance is not indicative of future results. Please see important dislosures at end of document.
Relative to the S&P 500 Index, stock selection was the primary driver of outperformance in the quarter. Sectoral allocation was again negative, largely due to our overweight in Consumer Discretionary and zero weight in Energy.
During the quarter, Broadcom, Starbucks and Roper Technologies were among the largest absolute contributors to returns. Advance Auto Parts (AAP) and Zoetis were our only two negative returning stocks. AAP was the largest detractor after reporting another disappointing quarter.
When we initially invested in AAP in mid-2021, our thesis was that company was in a solid industry but operationally lagged its public peers. Management had embarked on a multi-year operational improvement plan and the process changes they were making were significant.
We knew going in improvements would not come in a straight line and not be without challenges. However, given the combination of our dividend prediction (amongst the best dividend growth in the market at the time), the attractive industry dynamics and the inexpensive valuation (AAP was trading at a 6.5% FCF yield on enterprise value at the time), we were willing to take on the execution risk around the improvement plan.
The company struggled on two fronts this year. The first was that they could not meet demand for certain products where the assortment was moved to private label due to supply chain challenges. Management has identified and implemented actions to address these issues and we expect to see improvement going forward.
Secondly, two of AAP’s largest competitors decided to sacrifice their own margins to gain share in the do-it-for-me (DIFM) channel, where they both trail AAP. AAP’s management had a decision to make, protect margins to achieve their guidance and lose further share or respond in kind. They chose the latter. We think they made the right decision as any loss in sales would have had a negative effect on margins regardless. This current pricing dynamic is uncharacteristic for the industry which has generally been well behaved from that perspective. We continue to monitor the situation closely but believe management has taken a prudent stance in their outlook and the initial share price decline following the quarter went too far.
As part of our regular rebalancing process in November, Dollar General and Starbucks were trimmed. The proceeds were allocated to Intuit, Zoetis, Mastercard, Lowe’s and Moody’s.
For the year, the top contributors to portfolio returns were Activision Blizzard, UnitedHealth Group and Dollar General, while the bottom three were Zoetis, Intuit and Applied Materials. All three detractors experienced significant multiple contraction during the year despite solid underlying fundamentals.
Exhibit 6. Top Annual Detractors Underlying Fundamentals

Note: EPS is based on adjusted EPS comparable to consensus estimates. Dividend growth is based on the last quarterly payment.
Source: FactSet, Bristol Gate Capital Partners.
Relative to the benchmark, our stock selection was positive but entirely offset by sector allocation. Our zero weight in Energy had an almost 220 basis point negative impact on relative annual returns. As we have highlighted previously, it is not unusual for us to have low exposure to commodity related markets due to our process and their unpredictable nature.
It has undoubtedly been a trying year. From our perspective, times like these offer attractive opportunities for long-term investors. Valuations have been reset. Inflation, while persistent, appears to have peaked. The Fed is likely closer to the end of the hiking cycle than the beginning. An economic recession sometime in 2023 has become a consensus view and markets have already discounted some of that. Although we continue to believe 2023 consensus expectations for double digit earnings growth for the broader market look optimistic considering slowing economic growth and rising costs, we are not investing in the entire market. We are looking for 22 companies that can grow their dividends at above average rates on the back of solid underlying fundamentals. Our disciplined process and philosophy aim to eliminate the noise market volatility creates and instead take advantage of it. There is a broader offering of investment opportunities available at more attractive valuations than existed a year ago, and we enter the new year enthusiastic about the future for our clients.
Canadian Equity Strategy (all returns CAD)
The Canadian Equity strategy underperformed the S&P/TSX Composite Index during the quarter, finishing in line with the benchmark for year (net basis), erasing almost all of a significant relative deficit to the index (~700bps) that we faced after Q1/22.
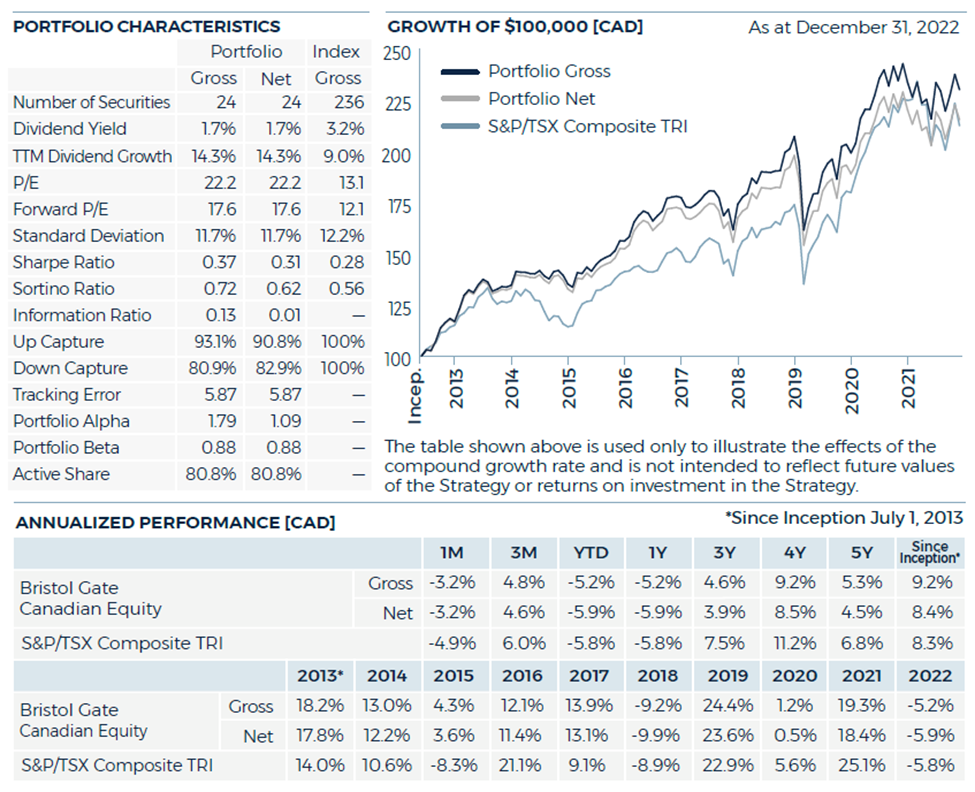
Source: Bristol Gate Capital Partners. There is a risk of loss inherent in any investment; past performance is not indicative of future results. Please see important disclosures at end of document.
Stock selection in the Industrials, Materials and Consumer Discretionary sectors and having no exposure to the Energy sector drove the relative underperformance in the quarter. This was partially offset by both our overweight and stock selection in the Information Technology sector, and no exposure to Utilities. Stella Jones, Enghouse and Element Fleet were among the largest absolute contributors to returns, while CCL Industries, Waste Connection and Brookfield Corp. were among the largest detractors.
As part of our regular rebalancing process, in November we trimmed both Waste Connections and Intact Financial to our target equal weights. The proceeds were allocated to Open Text, Premium Brands and Zoetis.
On a relative basis for the year, not having any exposure to Energy cost us over 400bps of relative performance. This was larger than what we experienced in the US due to the sector’s weight in the Canadian Index. Our portfolio was able to overcome that hurdle due to solid stock selection and the underlying fundamental strength of our holdings. Over the trailing 12 months (the December quarter has yet to be reported), our portfolio companies delivered median ~16% revenue growth, ~15% EPS growth and their latest quarterly dividends were ~11% higher than the year ago period.
Firm Update
This year we were thrilled that we were able to once again see many of our valued clients in person as our sales and investment teams have slowly resumed traveling. We have returned to a new normal, hybrid work environment this year. Our culture is one of trust and accountability, and we are proud of how we navigated the challenges that the pandemic brought to the workplace.
As we look ahead to the next year, our priority remains on finding the best possible ways to help our clients achieve their goals. We are always looking for ways to improve and make our investment process more robust. In addition to the two projects discussed earlier, others remain at various stages of completion.
We are also delighted to welcome Laura Hall to the team in the role of Operations Analyst. Laura is an avid learner, evidenced by the fact that she has a double major undergraduate degree, which is only outnumbered by how many pet dogs she has (3!).
To all our clients, thank you for your ongoing support and trust. We are determined to do everything we can to provide you continued income growth and strong investment returns going forward. If we have not done so already, we hope to see you in person sometime soon. In the meantime, we wanted to highlight two upcoming webinar events. On January 31st, our CIO, Izet Elmazi, will be presenting at the CFA Society Toronto’s Annual Equity Symposium. He will be discussing our investment process and highlighting a company we own in the portfolio. Then on February 9th, we will be hosting the third installment of our Speaker Series. This edition will feature Chris Miller, author of the 2022 FT Business Book of the Year, Chip War: The Fight for the World’s Most Critical Technology. We believe Chris will provide fascinating insight on a very relevant current event. We hope you can join us for both.
Sincerely,
The Bristol Gate Team
DISCLAIMER: This piece is presented for illustrative and discussion purposes only. It should not be considered as personal investment advice or an offer or solicitation to buy and/or sell securities and it does not consider unique objectives, constraints, or financial needs of the individual. Under no circumstances does this piece suggest that you should time the market in any way or make investment decisions based on the content. Investors are advised that their investments are not guaranteed, their values change frequently, and past performance may not be repeated. References to specific securities are presented to illustrate the application of our investment philosophy only, do not represent all of the securities purchased, sold or recommended for the portfolio, and it should not be assumed that investments in the securities identified were or will be profitable and should not be considered recommendations by Bristol Gate Capital Partners Inc. A full list of security holdings is available upon request. For more information contact Bristol Gate Capital Partners Inc. directly. The information contained in this piece is the opinion of Bristol Gate Capital Partners Inc. and/or its employees as of the date of the piece and is subject to change without notice. Every effort has been made to ensure accuracy in this piece at the time of publication; however, accuracy cannot be guaranteed. Market conditions may change and Bristol Gate Capital Partners Inc. accepts no responsibility for individual investment decisions arising from the use of or reliance on the information contained herein. We strongly recommend you consult with a financial advisor prior to making any investment decisions. Please refer to the Legal section of Bristol Gate’s website for additional information at bristolgate.com
Important disclosures
There is a risk of loss inherent in any investment; past performance is not indicative of future results. Prospective and existing investors in Bristol Gate’s pooled funds or ETF funds should refer to the fund’s offering documents which outline the risk factors associated with a decision to invest. Separately managed account clients should refer to disclosure documents provided which outline risks of investing. Pursuant to SEC regulations, a description of risks associated with Bristol Gate’s strategies is also contained in Bristol Gate’s Form ADV Part 2A located at www.bristolgate.com/regulatory-documents.
Gross returns in this report refer to the Bristol Gate US Equity Strategy Composite and Canadian Equity Strategy Composite. No allowance has been made for custodial costs, taxes, operating costs, management and performance fees, which will reduce performance. Past performance is not indicative of future results. Allowance for withholding tax in the US strategy composite is partially reflected in the composite returns for periods commencing January 2017 and after. The Net returns for the Bristol Gate US Equity Strategy Composite and Canadian Equity Strategy Composite are reflective of the maximum management fee charged by Bristol Gate of 1% and 0.70%, respectively.
The Bristol Gate US Equity Strategy Composite was formerly known as the Bristol Gate US Dividend Growth Composite until April 1, 2015. The Composite inception date was May 15, 2009. The Composite consists of equities of publicly traded, dividend paying US companies and is valued in US Dollars.
The Bristol Gate Canadian Equity Strategy Composite was formerly known as the Bristol Gate Canadian Dividend Growth Composite until April 1, 2015. The Composite inception date was July 1, 2013. The Composite consists of equities of publicly traded, dividend paying Canadian and US companies and is valued in Canadian Dollars.
The S&P 500® Total Return Index measures the performance of the broad US equity market, including dividend re-investment, in US dollars. This index is provided for information only and comparisons to the index has limitations. The benchmark is an appropriate standard against which the performance of the strategy can be measured over longer time periods as it represents the primary investment universe from which Bristol Gate selects securities. However, Bristol Gate’s portfolio construction process differs materially from that of the benchmark and the securities selected for inclusion in the strategy are not influenced by the composition of the benchmark. For example, the strategy is a concentrated portfolio of approximately equally weighted dividend-paying equity securities, rebalanced quarterly whereas the benchmark is a broad stock index (including both dividend and non-dividend paying equities) that is market capitalization weighted. As such, strategy performance deviations relative to the benchmark may be significant, particularly over shorter time periods. The strategy has concentrated investments in a limited number of companies; as a result, a change in one security’s value may have a more significant effect on the strategy’s value.
SPDR S&P 500 ETF Trust (SPY US) sourced from Bloomberg has been used as a proxy for the S&P 500® for the purpose of providing non-return based portfolio statistics and sector weightings.
The S&P/TSX Total Return Index measures the performance of the broad Canadian equity market, including dividend re-investment, in Canadian dollars. This index has been provided for information only and comparisons to the index has limitations. The benchmark is an appropriate standard against which the performance of the strategy can be measured over longer time periods as it represents the primary investment universe from which Bristol Gate selects securities. However, Bristol Gate’s portfolio construction process differs materially from that of the benchmark and the securities selected for inclusion in the strategy are not influenced by the composition of the benchmark. For example, the strategy is a concentrated portfolio of approximately equally weighted dividend-paying equity securities, rebalanced quarterly whereas the benchmark is a broad stock index (including both dividend and non-dividend paying equities) that is market capitalization weighted. As such, strategy performance deviations relative to the benchmark may be significant, particularly over shorter time periods. The strategy has concentrated investments in a limited number of companies; as a result, a change in one security’s value may have a more significant effect on the strategy’s value.
iShares Core S&P/TSX Capped Composite Index ETF (XIC CN) sourced from Bloomberg has been used as a proxy for the S&P/TSX Total Return Index for the purpose of providing non-return based portfolio statistics and sector weightings.
There is the opportunity to use leverage up to 30% of the net asset value. Leverage is not used as an investment tool to enhance returns, but for cash management needs of certain composite portfolios.
This Report is for information purposes and should not be construed under any circumstances as a public offering of securities in any jurisdiction in which an offer or solicitation is not authorized. Prospective investors in Bristol Gate’s pooled funds or ETF funds should rely solely on the fund’s offering documents, which outline the risk factors associated with a decision to invest. No representations or warranties of any kind are intended or should be inferred with respect to the economic return or the tax implications of any investment in a Bristol Gate fund.
Bristol Gate claims compliance with the Global Investment Performance Standards [GIPS®]. To receive a list of composite descriptions and/or a presentation that complies with the GIPS® standards, please contact us at info@bristolgate.com. Bristol Gate Capital Partners Inc. has been independently verified for the periods commencing May 2009 until December 2015 by Ashland Partners International PLLC and from January 1, 2016 – December 31, 2020 by ACA Group, Performance Services Division.
This piece is presented for illustrative and discussion purposes only. It should not be considered as personal investment advice or an offer or solicitation to buy and/or sell securities and it does not consider unique objectives, constraints, or financial needs of the individual. Under no circumstances does this piece suggest that you should time the market in any way or make investment decisions based on the content. Investors are advised that their investments are not guaranteed, their values change frequently, and past performance may not be repeated. References to specific securities are presented to illustrate the application of our investment philosophy only, do not represent all of the securities purchased, sold or recommended for the portfolio, and it should not be assumed that investments in the securities identified were or will be profitable and should not be considered recommendations by Bristol Gate Capital Partners Inc. A full list of security holdings is available upon request. For more information contact Bristol Gate Capital Partners Inc. directly. The information contained in this piece is the opinion of Bristol Gate Capital Partners Inc. and/or its employees as of the date of the piece and is subject to change without notice. Every effort has been made to ensure accuracy in this piece at the time of publication; however, accuracy cannot be guaranteed. Market conditions may change and Bristol Gate Capital Partners Inc. accepts no responsibility for individual investment decisions arising from the use of or reliance on the information contained herein. We strongly recommend you consult with a financial advisor prior to making any investment decisions. Please refer to the Legal section of Bristol Gate’s website for additional information at bristolgate.com.
A Note About Forward-Looking Statements
This report may contain forward-looking statements including, but not limited to, statements about the Bristol Gate strategies, risks, expected performance and condition. Forward-looking statements include statements that are predictive in nature, that depend upon or refer to future events and conditions or include words such as “may”, “could”, “would”, “should”, “expect”, “anticipate”, “intend”, “plan”, “believe”, “estimate” and similar forward-looking expressions or negative versions thereof.
These forward-looking statements are subject to various risks, uncertainties and assumptions about the investment strategies, capital markets and economic factors, which could cause actual financial performance and expectations to differ materially from the anticipated performance or other expectations expressed. Economic factors include, but are not limited to, general economic, political and market factors in North America and internationally, interest and foreign exchange rates, global equity and capital markets, business competition, technological change, changes in government regulations, unexpected judicial or regulatory proceedings, and catastrophic events.
Readers are cautioned not to place undue reliance on forward-looking statements and consider the above-mentioned factors and other factors carefully before making any investment decisions. All opinions contained in forward-looking statements are subject to change without notice and are provided in good faith. Forward-looking statements are not guarantees of future performance, and actual results could differ materially from those expressed or implied in any forward-looking statements. Bristol Gate Capital Partners Inc. has no specific intention of updating any forward-looking statements whether as a result of new information, future events or otherwise, except as required by securities legislation.
 Takes 2 minutes